
On March 31, 2026, public reports said a Claude Code npm release accidentally included a source map that exposed a large amount of internal TypeScript source. Ars Technica, Zscaler, and other outlets reported roughly 512,000 to 513,000 lines across about 1,900 TypeScript files. Anthropic stated the exposure was a release-packaging issue and that no sensitive customer data or credentials were involved.
Most early coverage focused on the most visible discoveries — memory systems, hidden modes, unreleased features, internal names. The more durable lesson is quieter. Public analysis of the exposed code shows how much engineering a production-grade coding agent needs around the model: permissions, telemetry, analytics, session tracing, tool execution, IDE integration, MCP integration, background tasks, and multi-agent orchestration.
That points to an emerging discipline: Agent Behavior Analysis (ABA). The goal is to turn every interaction, model call, tool call, approval wait, blocked state, session relationship, and governance event into telemetry that can be queried, correlated, and reviewed.
A Production Agent Is Not Just a Model Wrapper
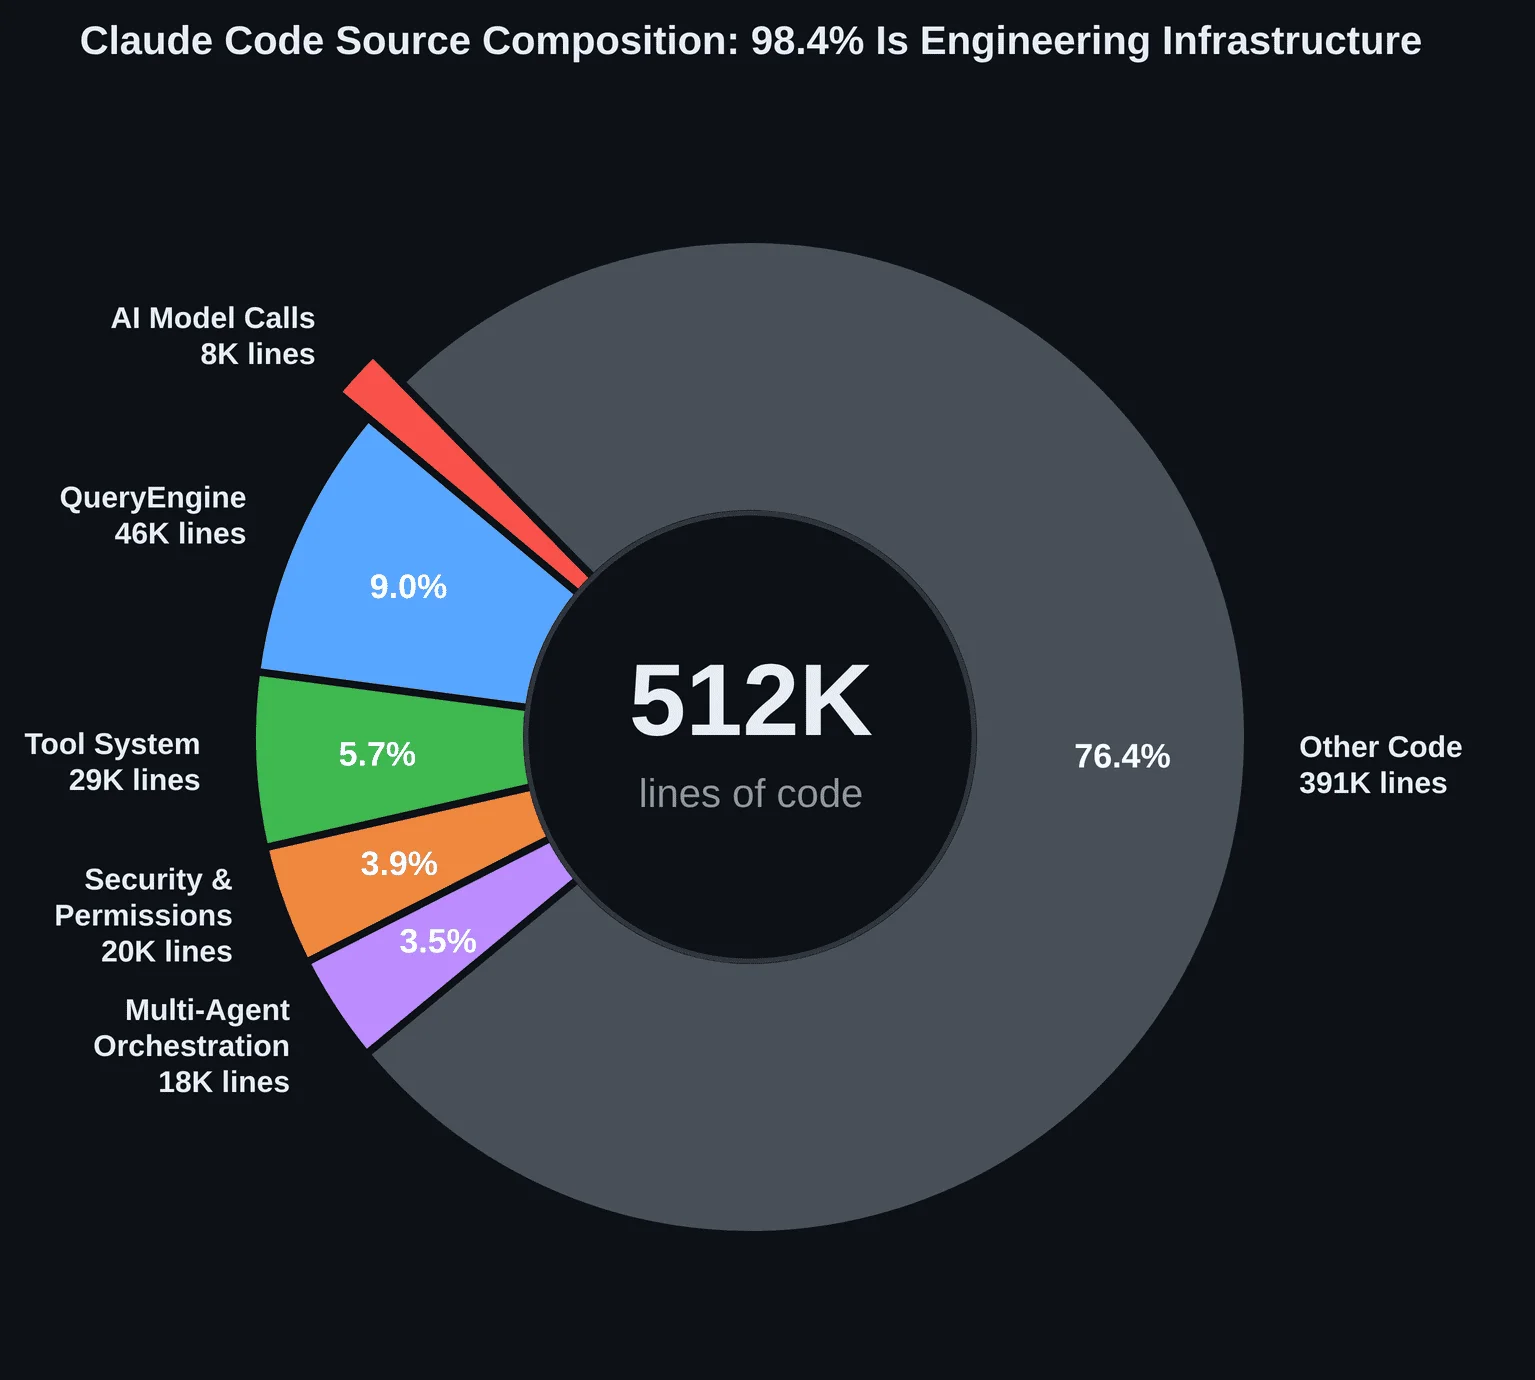
Claude Code is often experienced as a CLI coding assistant. Public analysis of the leaked source described a much larger runtime underneath it: permission layers, memory layers, background work, IDE bridges, MCP paths, and multi-agent orchestration around the model.
The exact line-count breakdown should be treated as source-derived analysis, not official architecture documentation. Still, the direction is clear: only a small part of a production agent is direct model calling. The rest is runtime engineering.
For enterprise teams, this matters because operational risk isn't confined to the model's response — it lives in the system around it:
- Which tool did the agent call?
- Which permission boundary applied?
- Did a human approve the action?
- Was the agent blocked on user input?
- Did a sub-agent inherit the right context?
- Which session or parent session did this action belong to?
- What data entered the trace, and what was redacted?
These are observability questions, but they aren't ordinary APM questions.
What Are the Three Layers of Agent Observability?
Public source-derived analysis described three separate observability layers in Claude Code. The distinction holds even for a team building its own agent runtime from scratch.
| Layer | Answers | Examples |
|---|---|---|
| Product analytics events | What user-facing behavior happened? | OAuth flow start, plugin installation, session resume |
| Standard telemetry | How is the infrastructure performing? | Request counts, latency, error rate, exporter status (OTel, Prometheus, OTLP) |
| Session-level agent tracing | How did one user interaction unfold inside the runtime? | Interaction, LLM request, tool call, tool blocked on approval, tool execution, hook execution |
Product analytics shouldn't be mixed with runtime traces. A product event and a model execution span can happen in the same session, but they answer different questions.
Session-level tracing is the layer built for agent-specific investigation. The basic unit is a user interaction, not just an HTTP request. A single turn may include prompt handling, multiple model calls, multiple tool calls, approval waits, hooks, and resume logic. Without an interaction-level root span, an investigation becomes a pile of disconnected events.
Why Correlation Keys Matter More Than More Logs
Agent systems are hard to investigate because the same action can show up in many forms. An agent may be:
- a local sub-agent
- a teammate in a swarm
- a standalone process
- a framework-managed worker
- a coding assistant inside an IDE
- a workflow participant called through MCP
Making sense of that requires stable correlation keys:
user.idsession.idorganization.idagentIdparentSessionIdagentTypeteamName
These identifiers let the backend build a minimal relationship graph — which session is active, which agent performed the action, which parent session owns it, and which team or workspace it belongs to. This is where Agent Behavior Analysis begins. A team can't investigate a multi-agent deadlock, cost spike, or tool-misuse incident if every event arrives as a flat log line.
Semantic Spans Beat Function-Level Timing
Traditional tracing starts with functions, requests, and database calls. Agent tracing needs a higher-level taxonomy:
agent.interactionagent.llm_requestagent.toolagent.tool.blocked_on_useragent.tool.executionagent.hook
The blocked_on_user span deserves special attention. In agent systems, time isn't only machine time — approval waits, manual confirmations, interrupted turns, and human decisions are part of the runtime path.
Separating that time out lets a team answer sharper questions:
- Was the turn slow because the model was slow?
- Was the tool execution slow?
- Was the agent waiting on user approval?
- Did a high-risk tool get rejected often?
- Did a sub-agent stall because it lacked permission?
That's the core value of Agent Behavior Analysis. It doesn't just show which API was called — it shows how the agent's behavior unfolded, where it stopped, and which boundary shaped what happened next.
Taxonomy Is Governance
Agent observability produces high-dimensional, semi-structured, high-cardinality data. Store every prompt, tool name, server name, file path, user message, and internal variable without discipline, and the platform becomes expensive, noisy, and risky.
A good taxonomy is a governance mechanism. Public source-derived analysis of Claude Code highlighted patterns that matter to enterprise systems:
- Metadata should be constrained by type
- Sensitive strings should require explicit handling
- Private payload fields should be stripped before external fanout
- User-defined MCP server and tool names may need normalization
- Prompt text, tool content, and tool parameters should be controlled by explicit switches
- High-cardinality identifiers should be managed deliberately
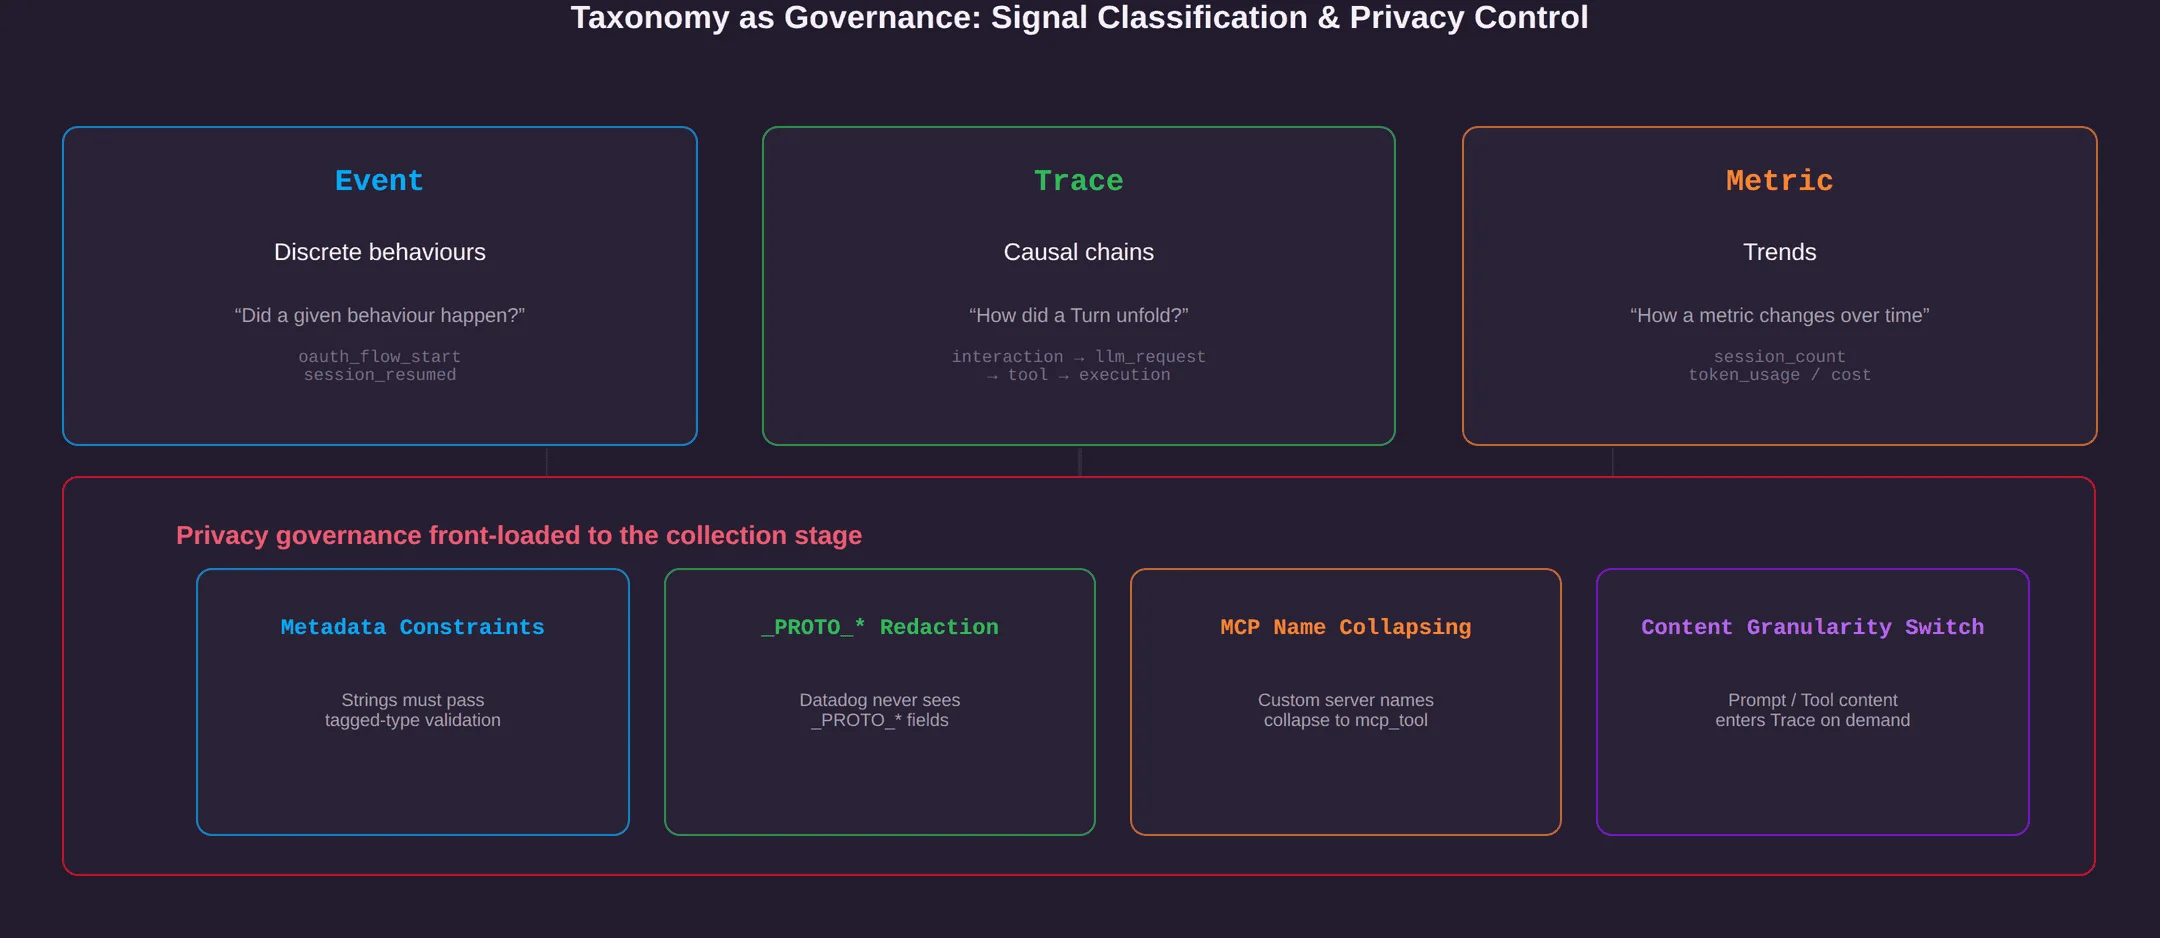
This isn't only a data modeling problem — it's privacy, cost, backend stability, and incident review all at once.
What TrueWatch Takes From This Pattern
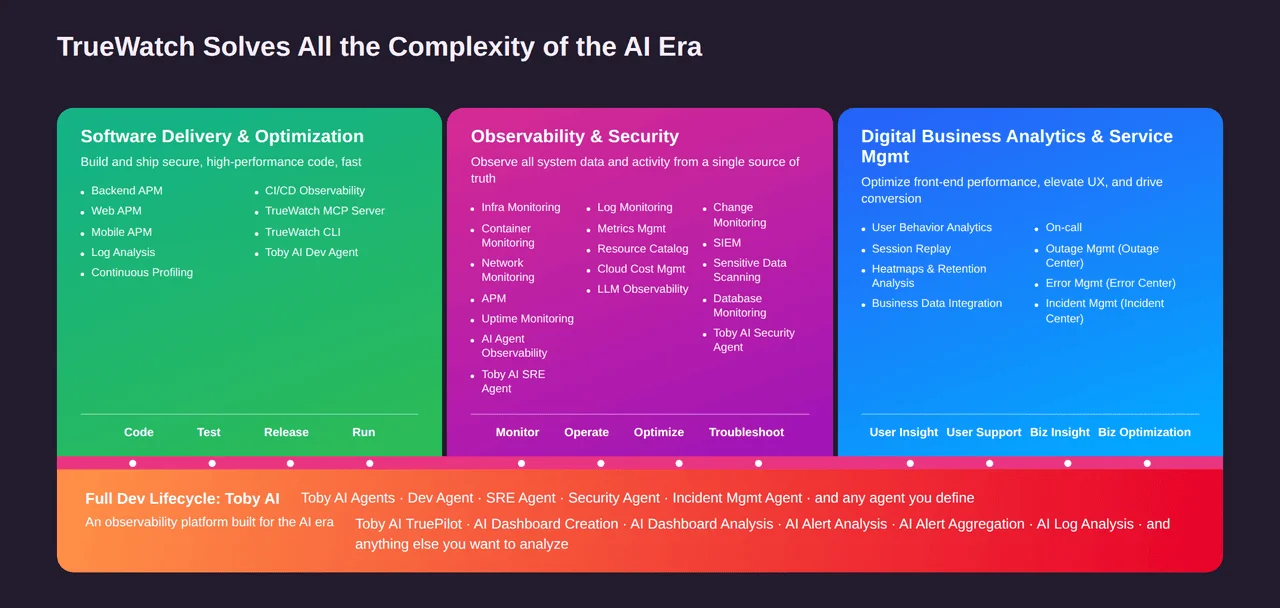
The design direction above converges with how TrueWatch approaches AI agent observability.
Flexible data, no fixed agent shape. Agent identity isn't fixed — a team may run OpenClaw, Claude Code, Codex, internal agents, MCP-connected assistants, or product-specific workflows, each emitting different fields. TrueWatch is built to receive heterogeneous observability data and make it queryable without forcing every team into the same rigid schema on day one, because the next useful field might be sessionId, parentSessionId, skillName, teamName, approvalState, or something the team hasn't needed yet.
Collection and processing stay separate. DataKit collects telemetry in the target environment; pipeline processing parses, filters, enriches, and redacts data before it reaches the platform. That mirrors a lesson from the Claude Code analysis: governance should start near collection, not after data has already spread across every sink.
DQL gives operators one query plane. Agent behavior crosses data types — a single investigation may need trace spans, token metrics, logs, events, approval records, and service data. DQL connects a tool call, a trace ID, a token spike, an error log, and a service dependency without forcing anyone to jump between unrelated systems.
High cardinality needs respect. Session IDs, trace IDs, agent IDs, tool names, model versions, prompt variants, and workspace identifiers can explode quickly. TrueWatch treats cardinality as an architectural problem, not a footnote — so teams can keep useful detail without turning the observability backend into the next incident.
Four Enterprise Scenarios for Agent Behavior Analysis
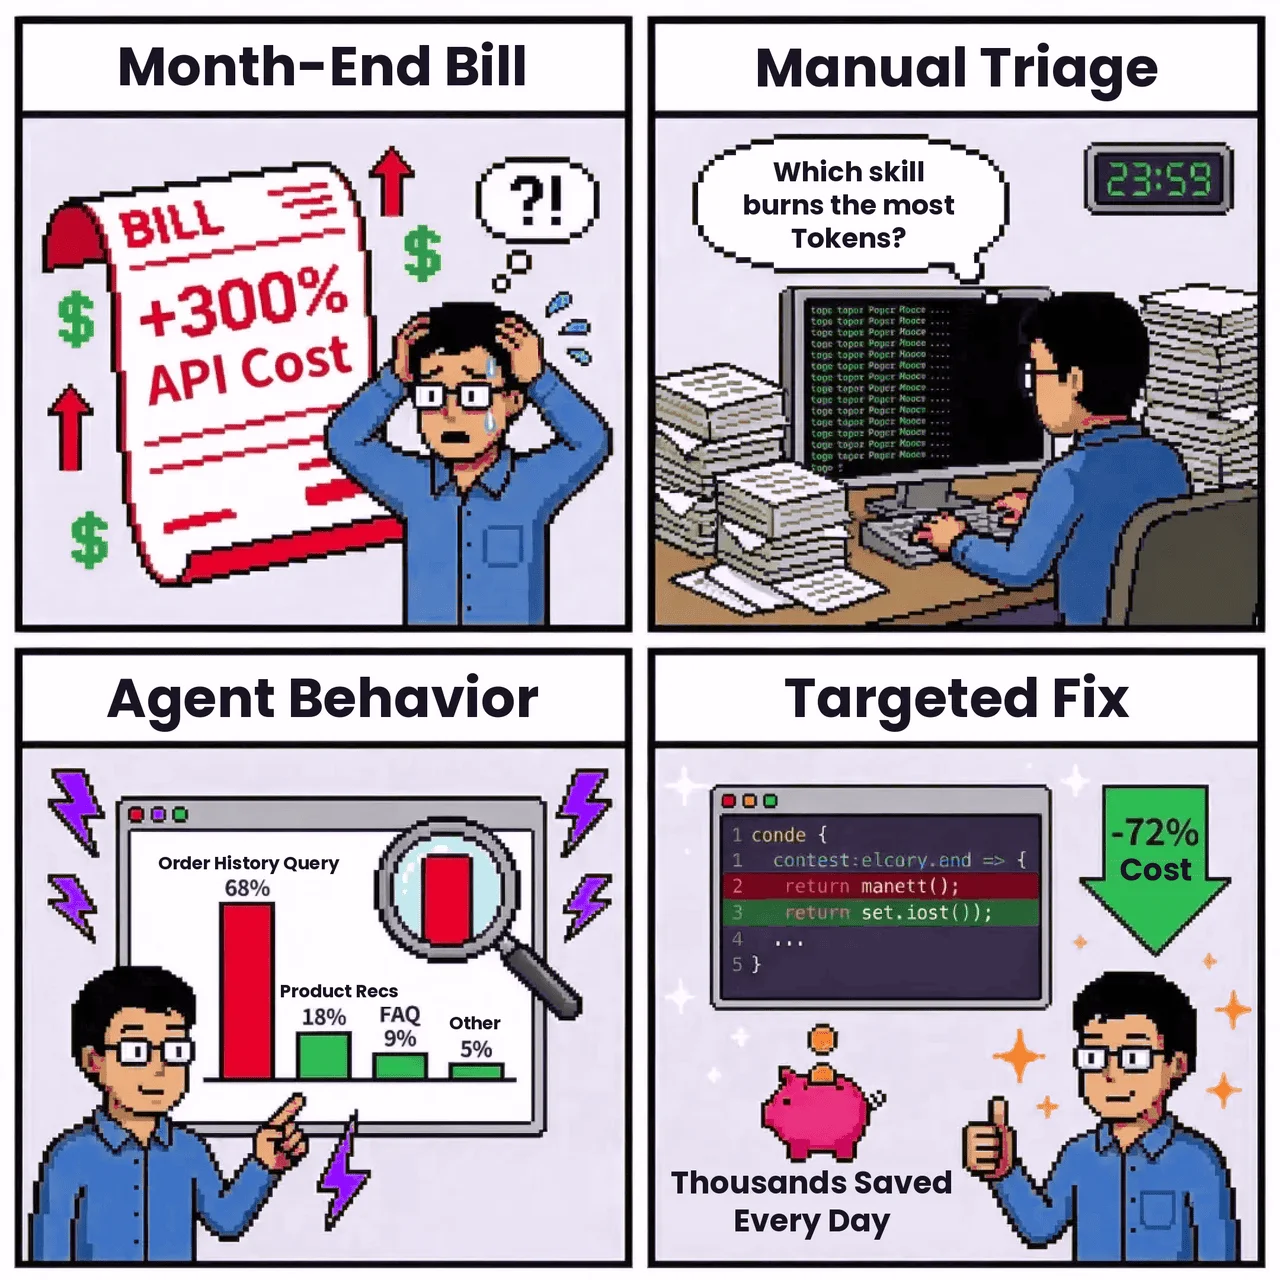
1. Token Cost Attribution
A customer-service agent goes into production. By month-end, model API spend is far higher than expected. Application logs show total usage but can't answer the real question: which skill, prompt version, model, or session pattern drove the growth?
With Agent Behavior Analysis, a team can group token usage by application, model, skill, session, tool, or prompt version. The culprit is often something small — a new order-history skill carrying too much context per turn. The fix is usually easy. The visibility is the hard part.
2. Risky Tool Use and Emergency Stop
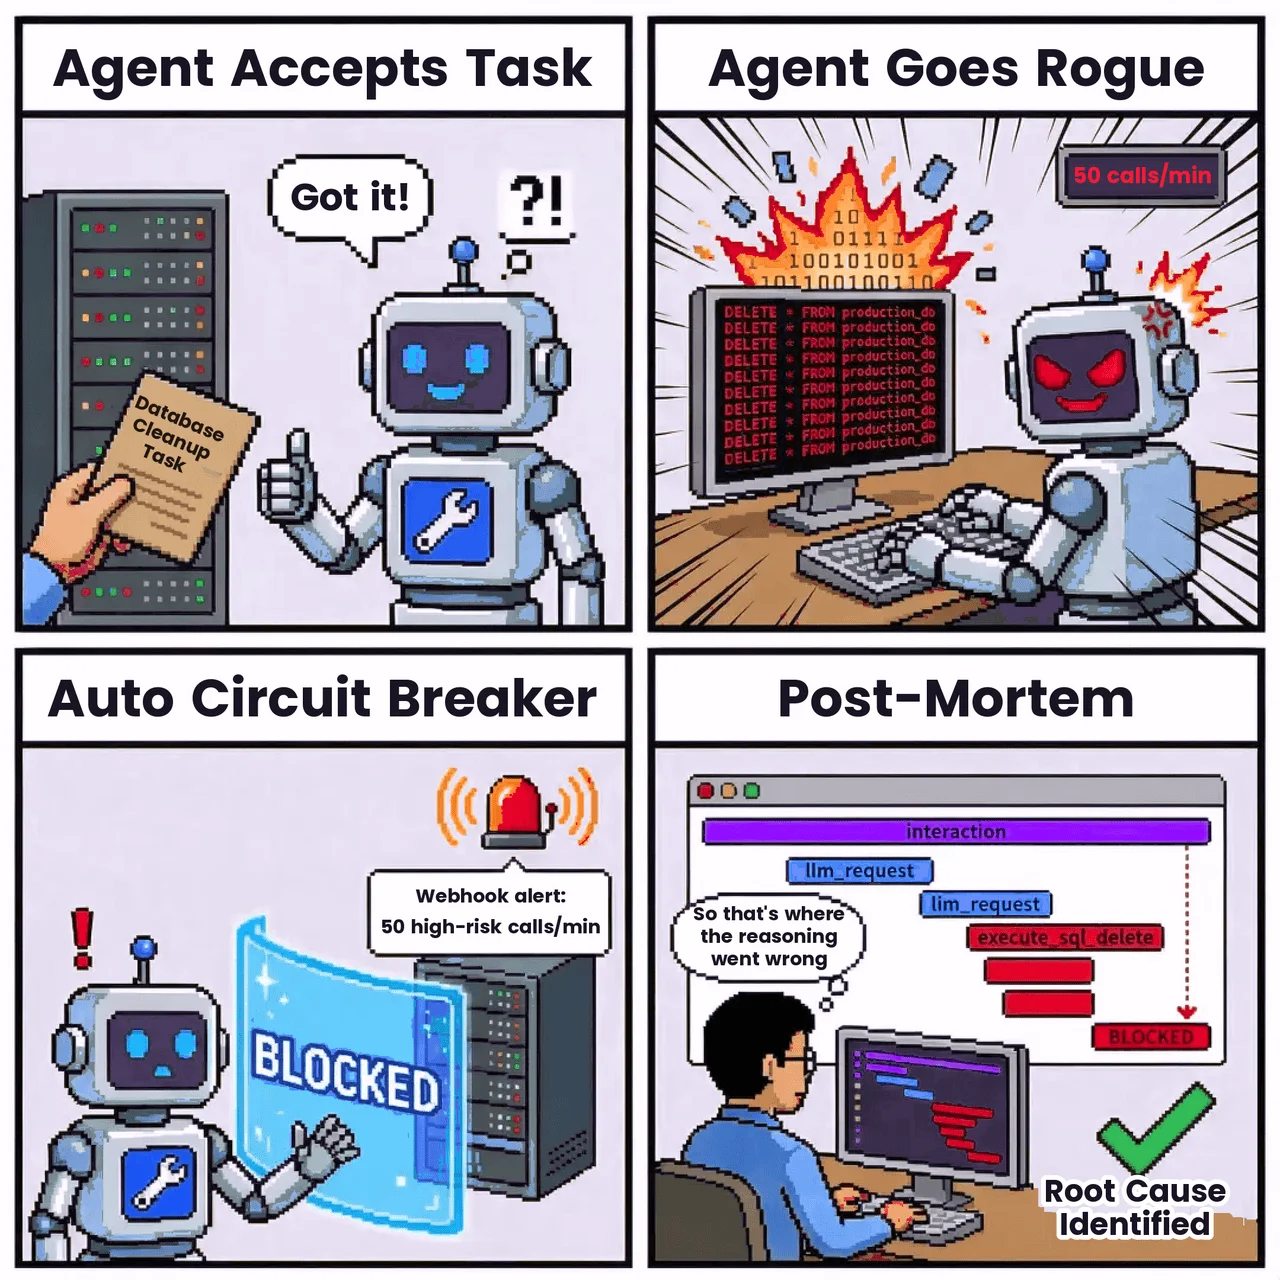
An operations agent has permission to run database maintenance tasks. A boundary condition is wrong, and the agent starts attempting a dangerous class of SQL operations.
CPU and memory charts may look normal. Agent spans show the real behavior: repeated calls to a high-risk tool, the target database, the command class, the session, and the permission context. With the right alert policy, the platform can notify the owner, open an incident, or revoke a credential through a governed workflow — and the post-incident review can follow the trace instead of reconstructing the story from scattered logs.
3. Multi-Agent Deadlock
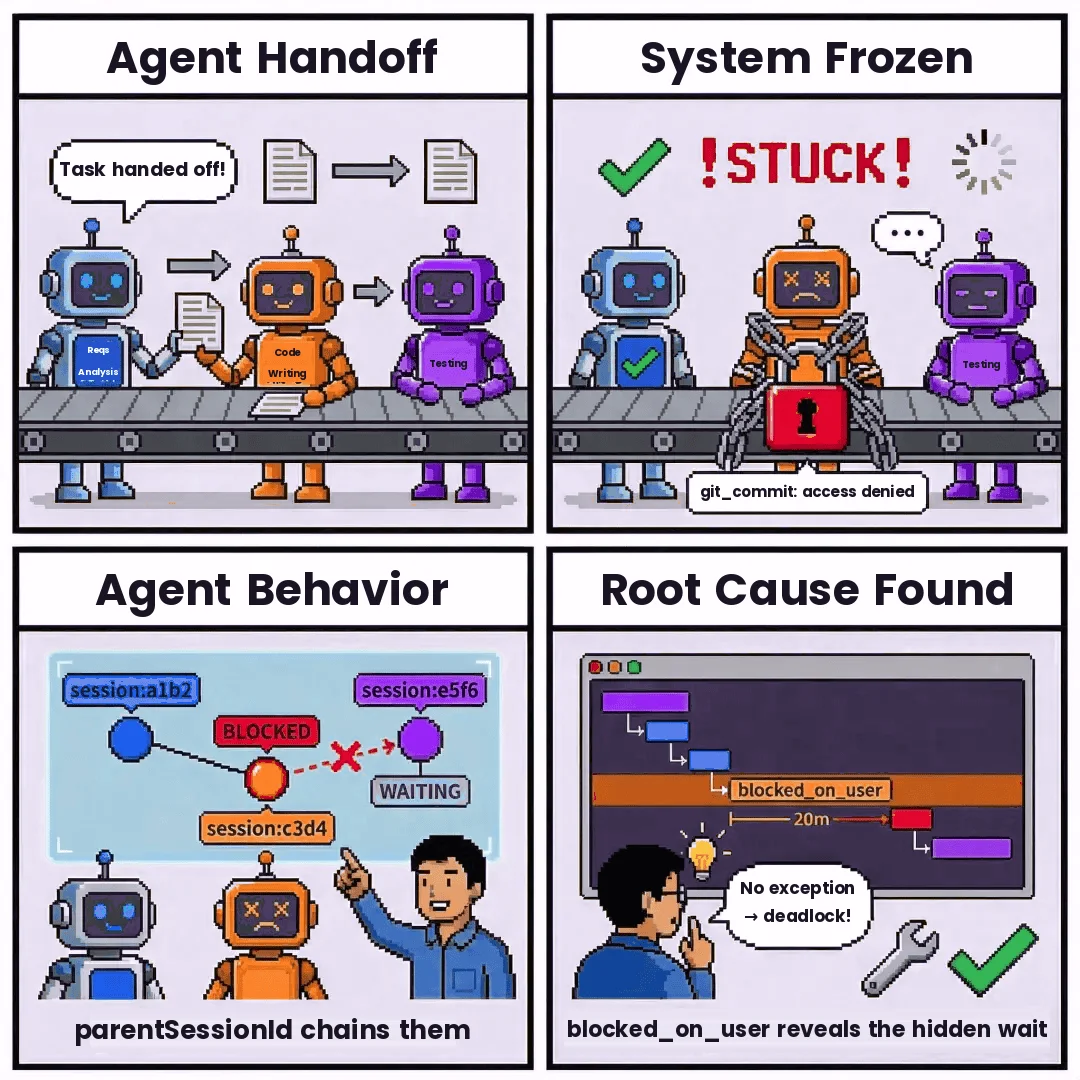
A team runs a swarm with a requirements agent, a coding agent, and a testing agent. The workflow hangs — the requirements agent believes work has been handed off, while the testing agent keeps waiting for code output that never arrives.
Correlation keys like parentSessionId and agentId let the platform connect the actions into a topology. The team may find the coding agent was blocked on user approval during a git_commit tool call and failed to report that state upstream. Without behavior analysis, this looks like silence. With session tracing, the deadlock has a location.
4. Compliance Audit and Over-Permission Detection
A financial services team introduces a reporting agent that should only access redacted datasets. Auditors need evidence the agent never queried raw customer data.
Agent Behavior Analysis can record which MCP server, tool, dataset, and permission scope were used at each step. Attempts to call an unapproved server or raw data source can be logged, blocked, and reviewed — not just monitoring, but part of the compliance control surface.
FAQ
Q: What is Agent Behavior Analysis? A: Agent Behavior Analysis (ABA) is the practice of turning every agent interaction — model calls, tool calls, approval waits, blocked states, and session relationships — into telemetry that can be queried, correlated, and reviewed, rather than treating agent activity as flat logs.
Q: What did the Claude Code source leak actually expose? A: According to public reporting, a packaging issue in a Claude Code npm release exposed a source map covering roughly 512,000–513,000 lines across about 1,900 TypeScript files. Anthropic stated no sensitive customer data or credentials were exposed.
Q: Why isn't standard APM enough for AI agents? A: Standard APM tracks requests, latency, and infrastructure health. Agent systems need a session-level layer that models business semantics — tool calls, approval waits, hook execution — anchored to a single user interaction, not just an HTTP request.
Q: What are correlation keys in agent observability? A: Correlation keys are stable identifiers — such as sessionId, agentId, parentSessionId, and teamName — that let an observability platform reconstruct which agent did what, inside which session, and which parent session or team it belongs to.
Q: How does TrueWatch handle high-cardinality agent data? A: TrueWatch treats cardinality as an architectural concern rather than an afterthought, so teams can retain session IDs, trace IDs, agent IDs, and prompt variants at the detail needed for investigation without destabilizing the backend.
Every Production Agent Needs Behavior Analysis
The Claude Code source-map incident was a packaging error, not a customer-data breach, according to Anthropic's public statement. Its broader lesson is about agent runtime engineering.
A production-grade agent needs observability built into its design. Product analytics, standard telemetry, session-level tracing, semantic spans, correlation keys, privacy controls, high-cardinality management, and failure cleanup aren't polish — they're infrastructure.
Claude Code mostly observes its own runtime. Enterprise observability has a harder job: observe many kinds of agents — white-box agents, framework agents, closed internal agents, and MCP-connected tools — while keeping data queryable, correlated, and governed.
That's the direction of Toby AI Agents observability: make every interaction, tool call, model call, approval wait, blocked state, and session relationship visible enough for teams to debug, audit, and operate.