1. Introduction
This guide shows you how to pull AWS CloudWatch metrics into TrueWatch using Automata → DataFlux Func, validate the data, connect AWS Cloud Billing, and build a simple FinOps dashboard with drill‑downs.
What you’ll accomplish
- Programmatic access to AWS metrics via a scheduled Automata job
- Metrics validation in Metrics → Metric Analysis and Metrics Management
- Cloud Billing ingestion and default cost dashboards
- A custom FinOps dashboard with a drill‑down link to an EC2 usage trend view
Estimated time: 45–60 minutes (excluding AWS and account approvals).
2. Prerequisites
| Requirement | Notes |
|---|---|
| TrueWatch workspace | You should already have a TrueWatch workspace. |
| Automata add‑on | In TrueWatch: Integrations → Extensions → DataFlux Func (subscription required). |
| AWS account | Your workloads already publish metrics to CloudWatch (e.g., EC2, EKS, ELB). |
| AWS programmatic access | Create an Access key (Access key ID + Secret access key) for a least‑privilege IAM principal used only for this integration. |
| (Recommended) IAM policy | Read‑only CloudWatch permissions (see Appendix A) and optional tag:GetResources if filtering by tags. |
3. Configure AWS Programmatic Access
Create (or use) an IAM principal dedicated to metrics collection and billing read access.
- Create an IAM user or role (e.g.,
truewatch-metrics-reader) with the read‑only policy in Appendix A. - Create an Access key (Access key ID + Secret access key) for this principal.
- Record the keys securely (you will paste these into Automata ENV).
- Scope & rotation: Use a restricted policy; rotate keys periodically; avoid reusing keys across environments.
4. Configure Automata to Pull Metrics from AWS
You’ll use Automata → DataFlux Func to install a CloudWatch collector script, wire it to environment variables (AWS credentials), publish it, and schedule a Cron.
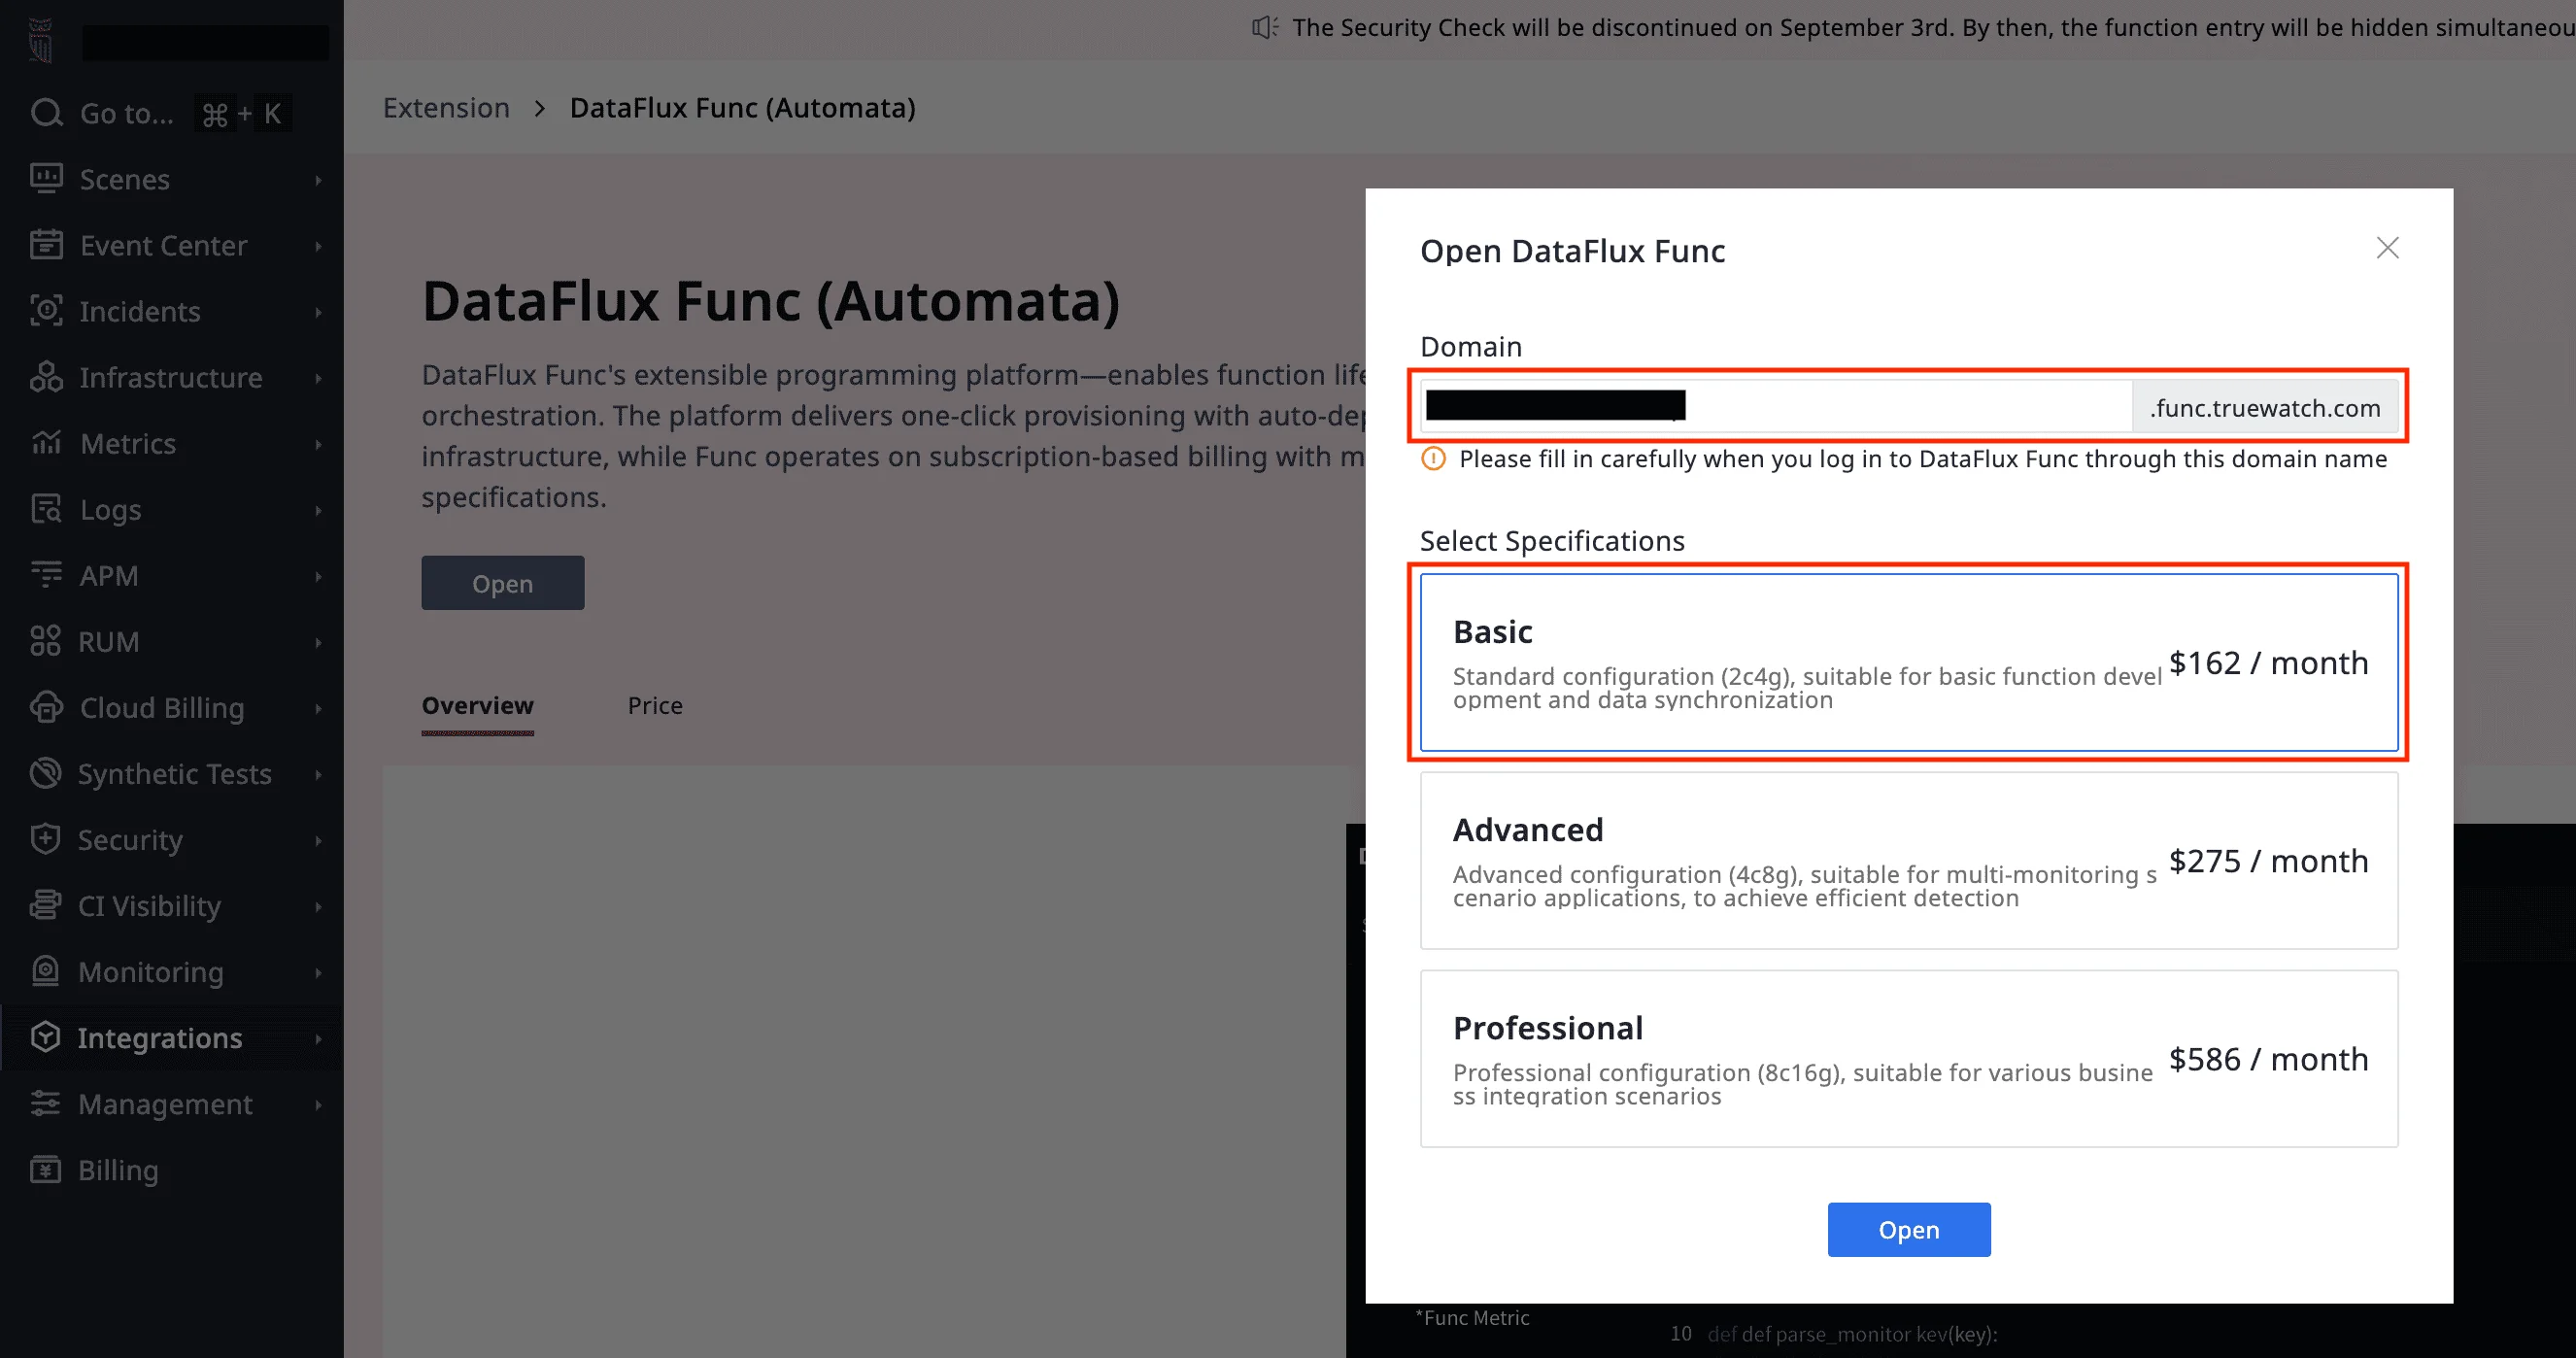
4.1 Create an Automata Subscription
- Select an Automata specification and specify a domain name. Read and accept the terms.
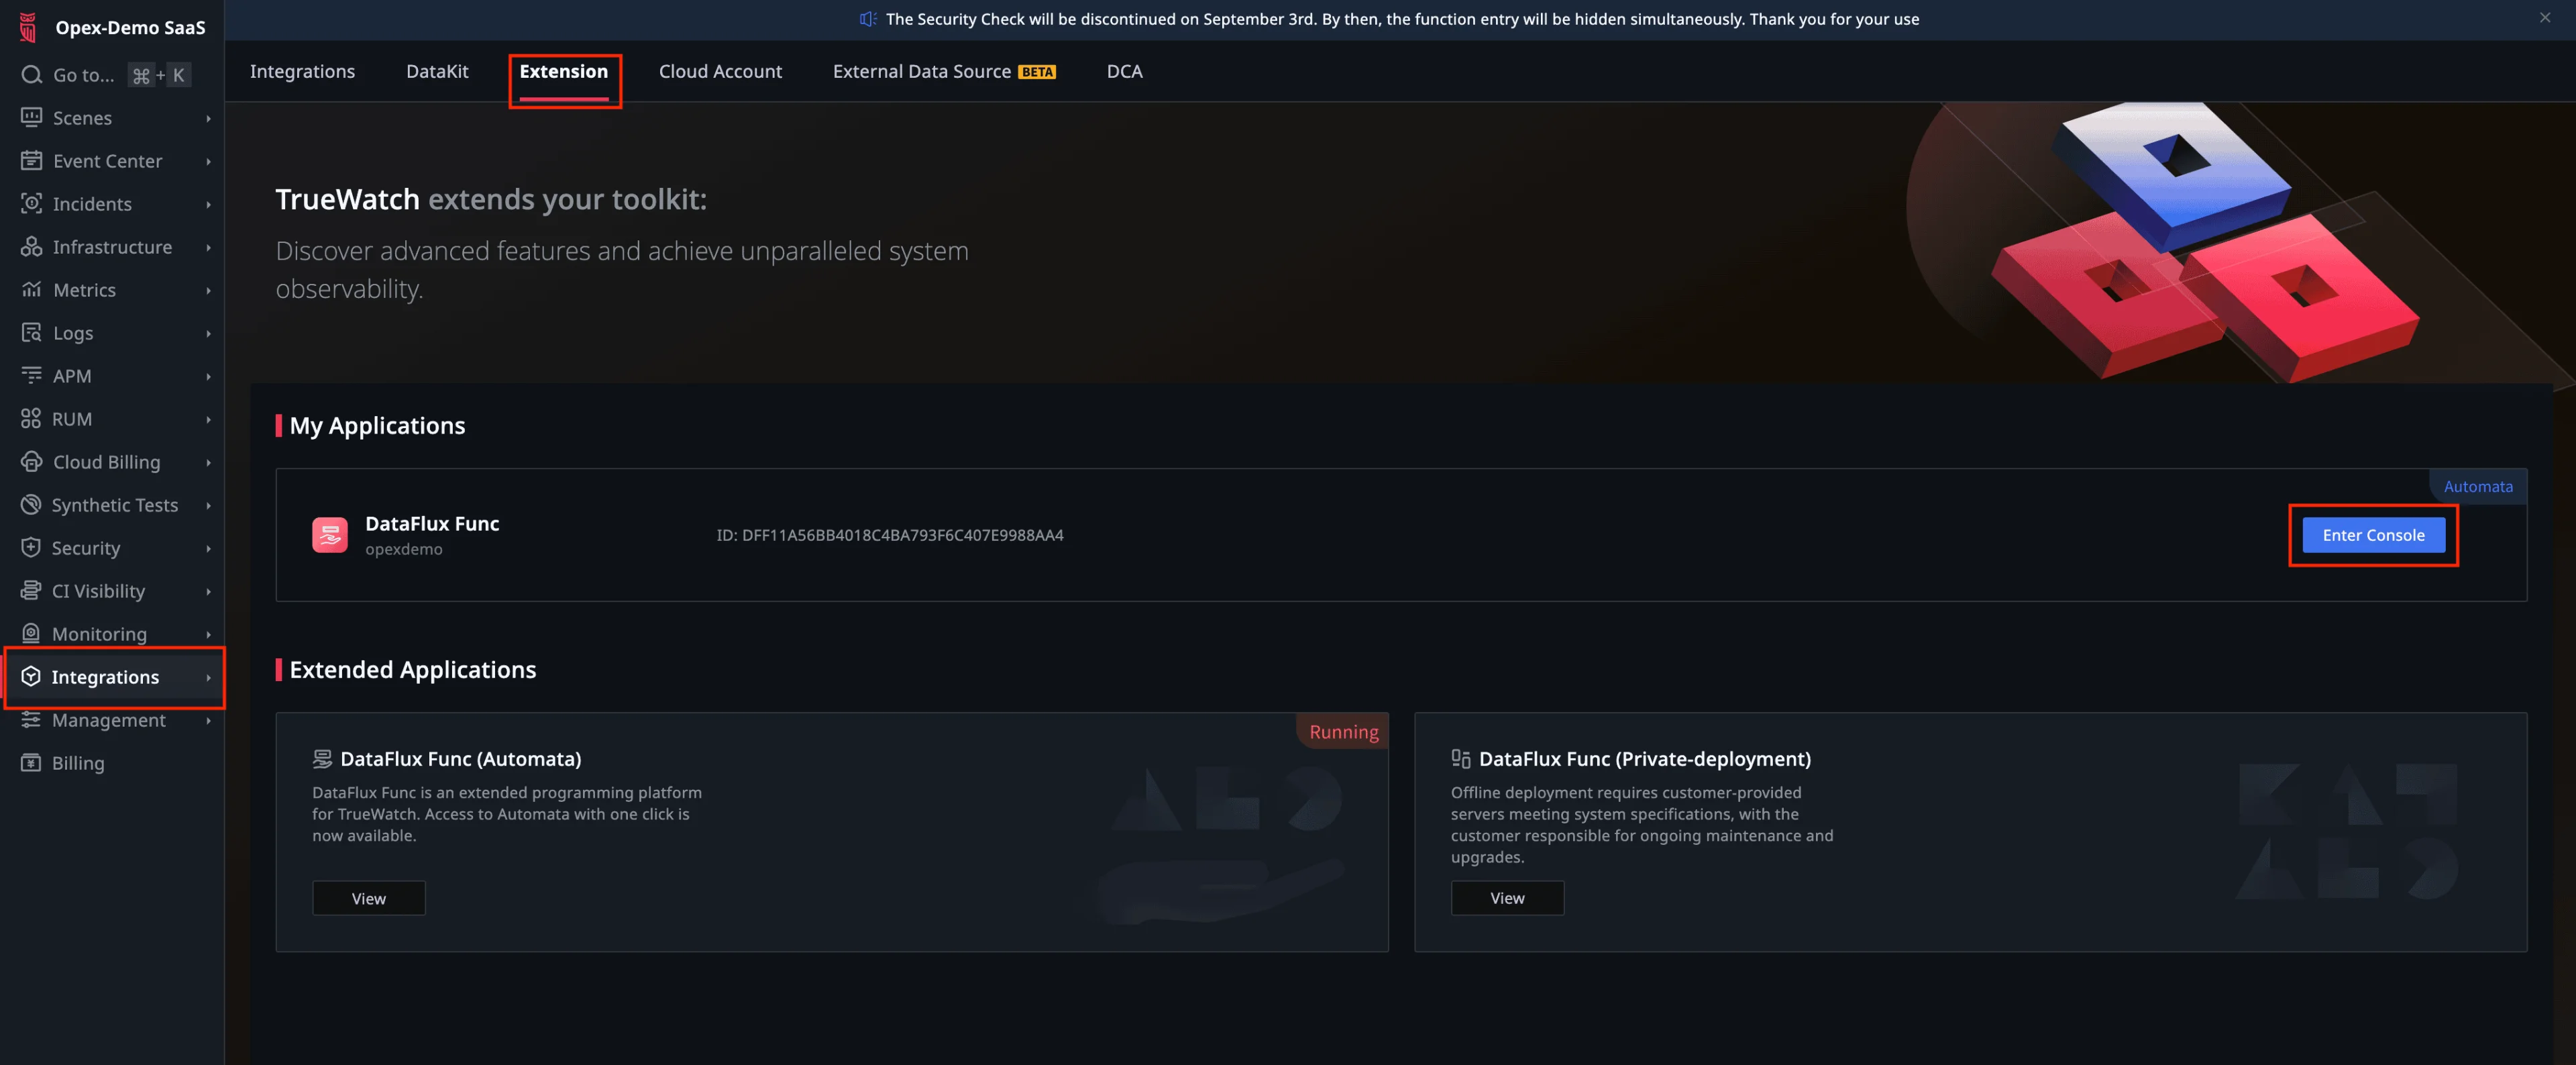
4.2 Open the Automata Console
- In TrueWatch navigate to Integrations → Extensions → DataFlux Func, then click Enter Console.
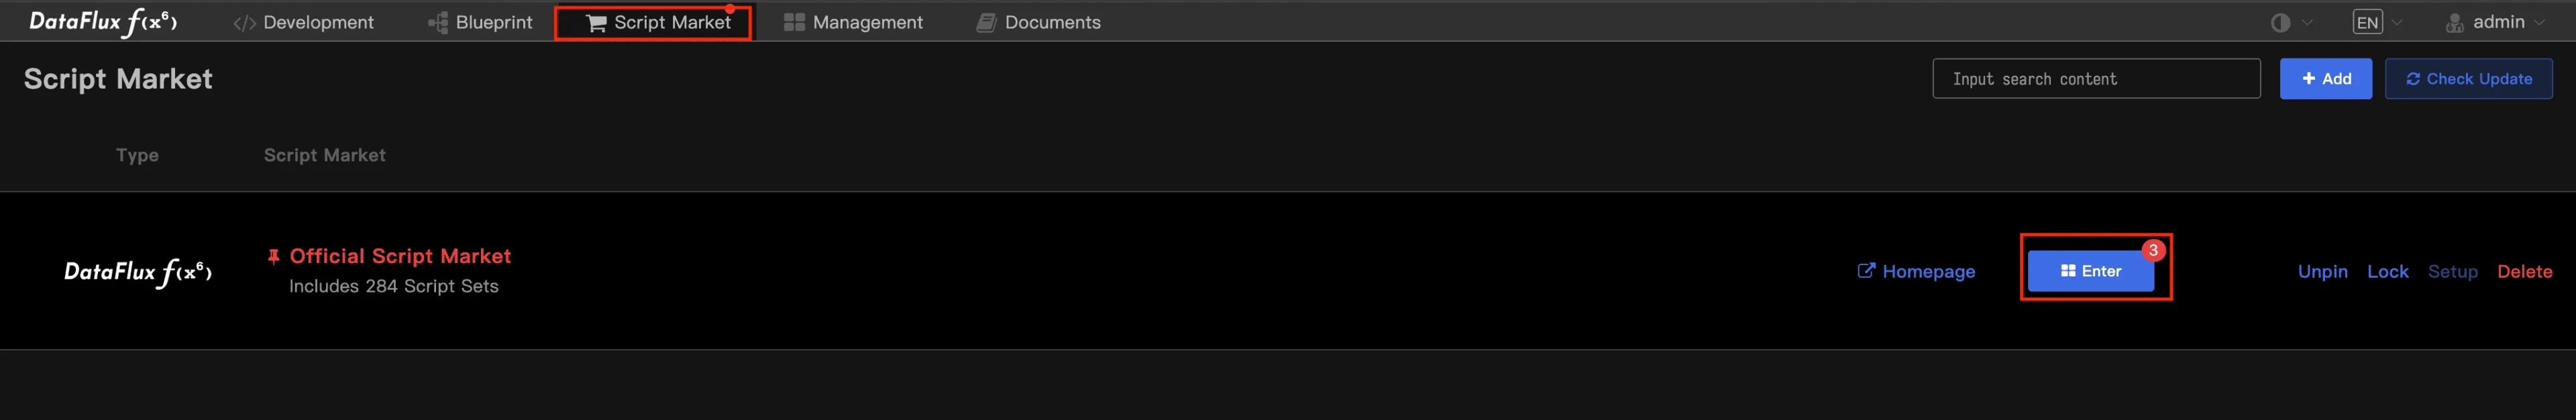
4.3 Install the CloudWatch Script from Script Market
- In DataFlux Func, go to Script Market and click Enter.
- Search for “CloudWatch” in the top‑right search bar and install the script.
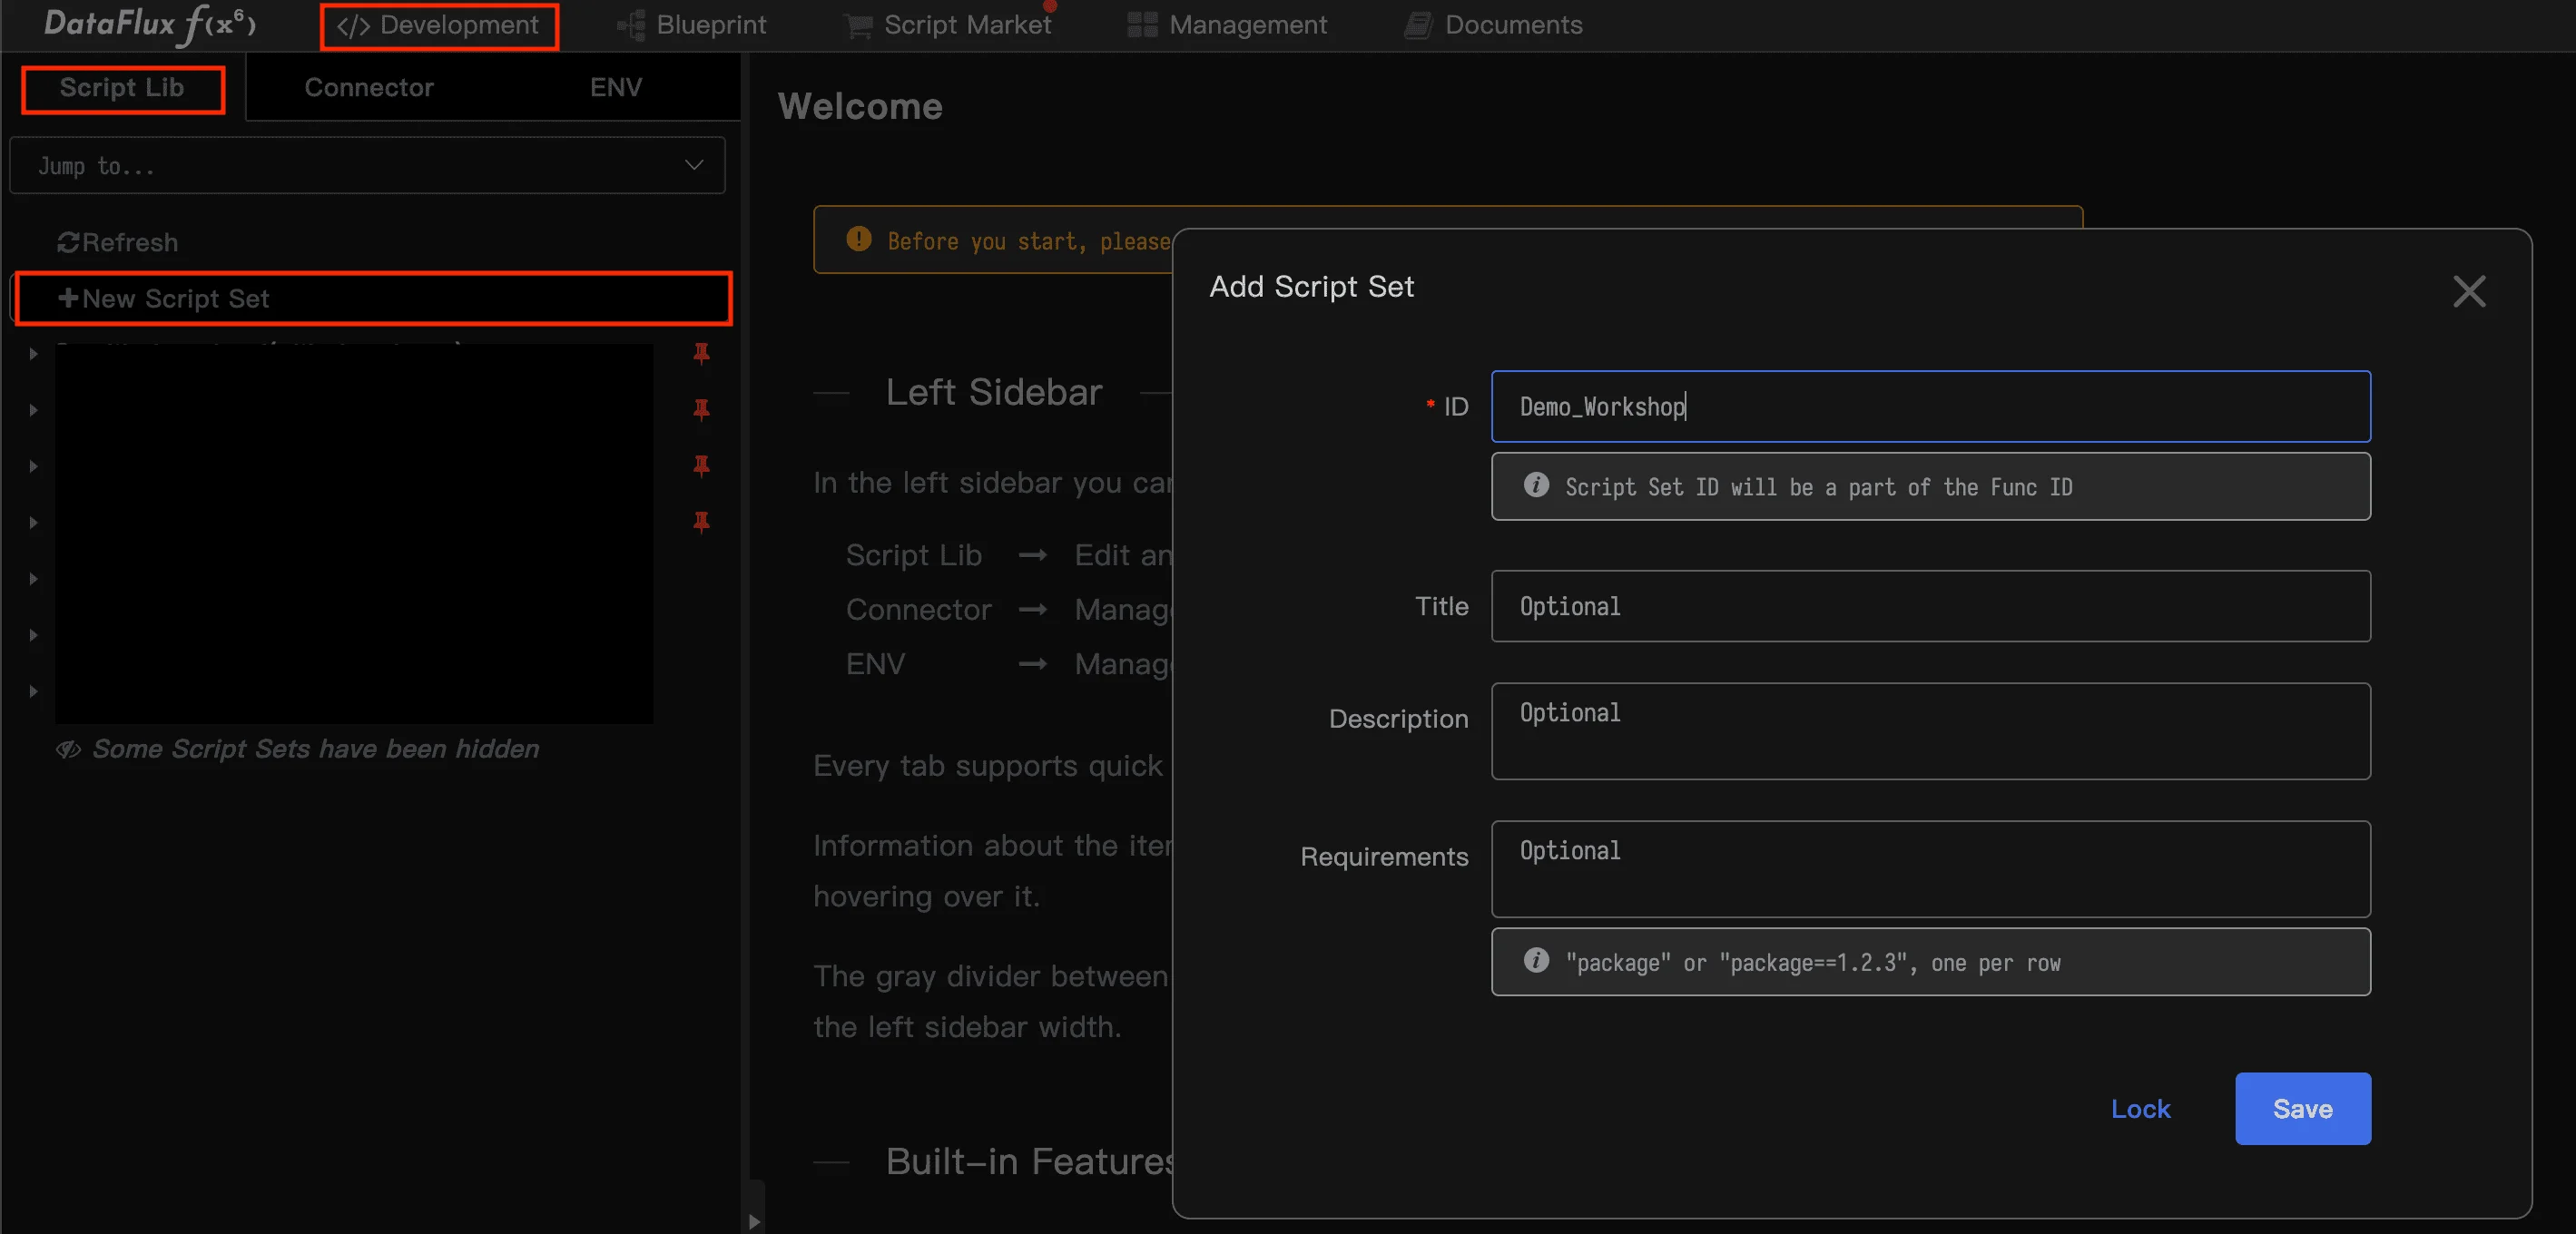
4.4 Create a Script Set (Workspace Folder)
- Navigate to Development → Script Lib, click + New Script Set, and give it an ID (e.g.,
Demo_Workshop).
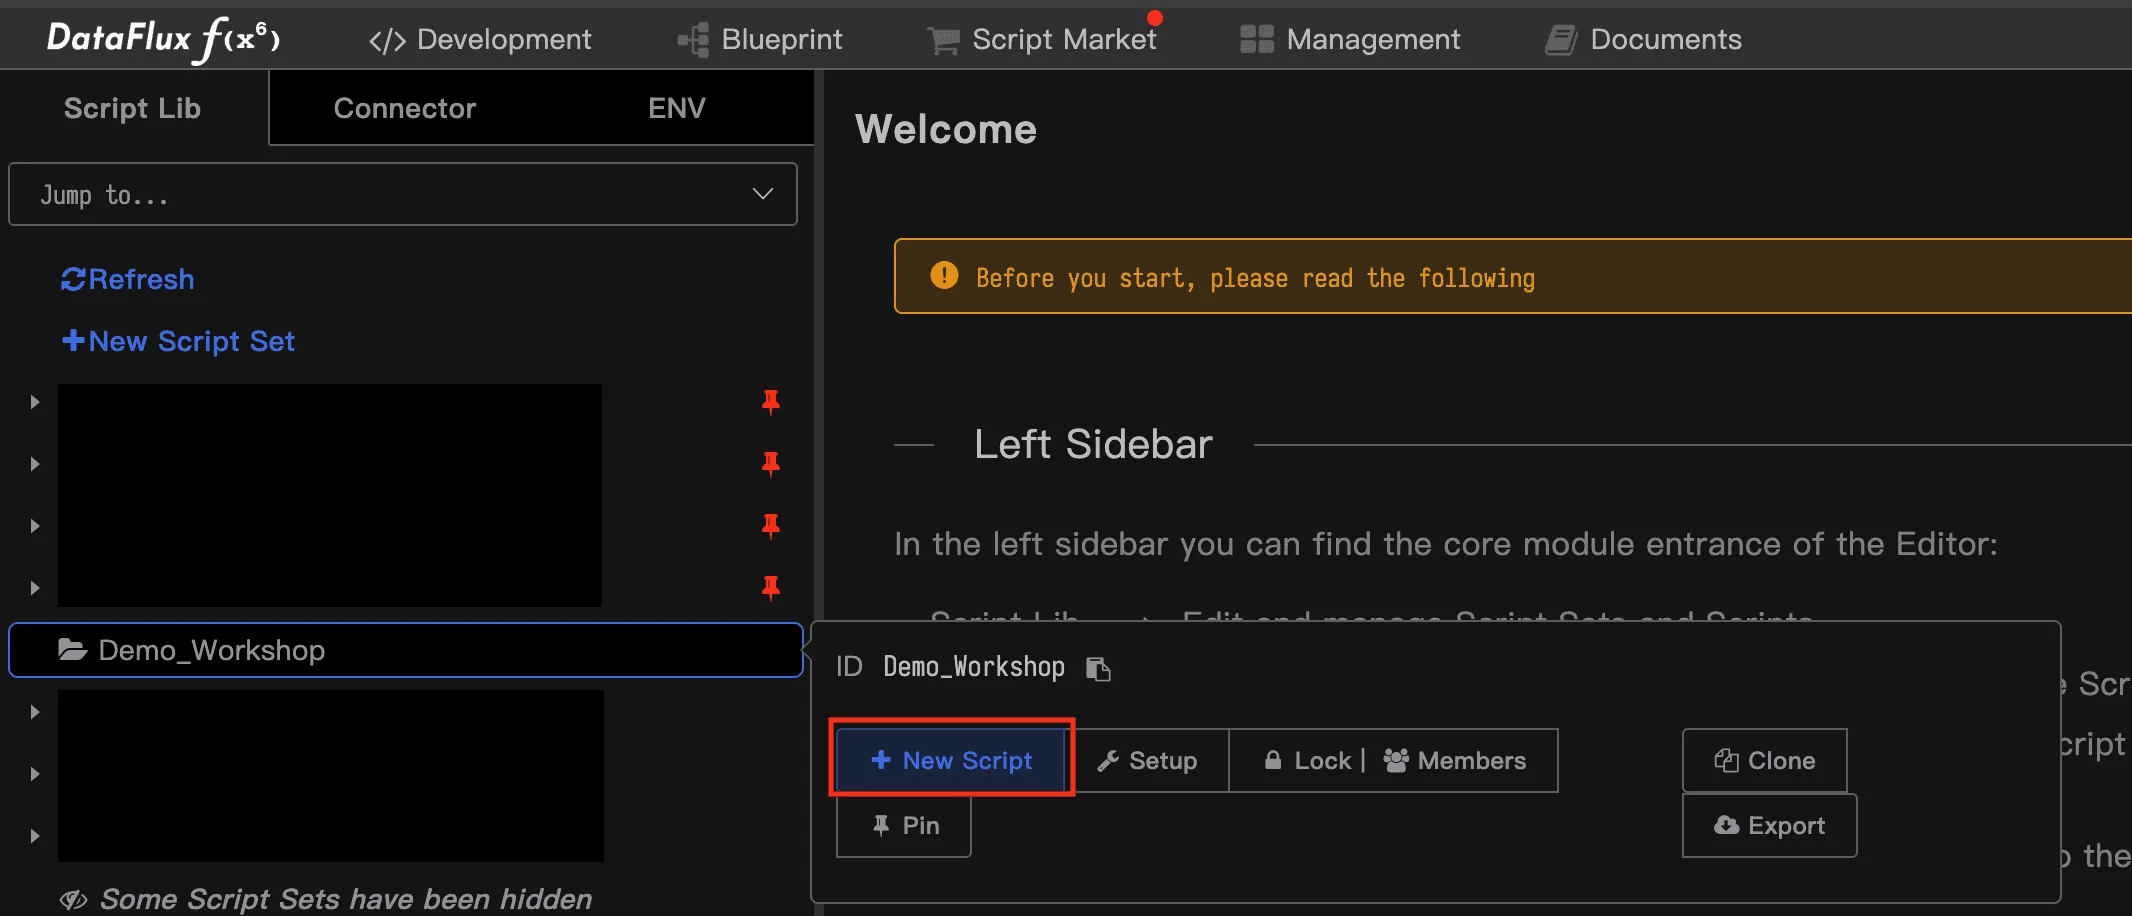
4.5 Create a New Script
- Under the new folder, hover and click + New Script.
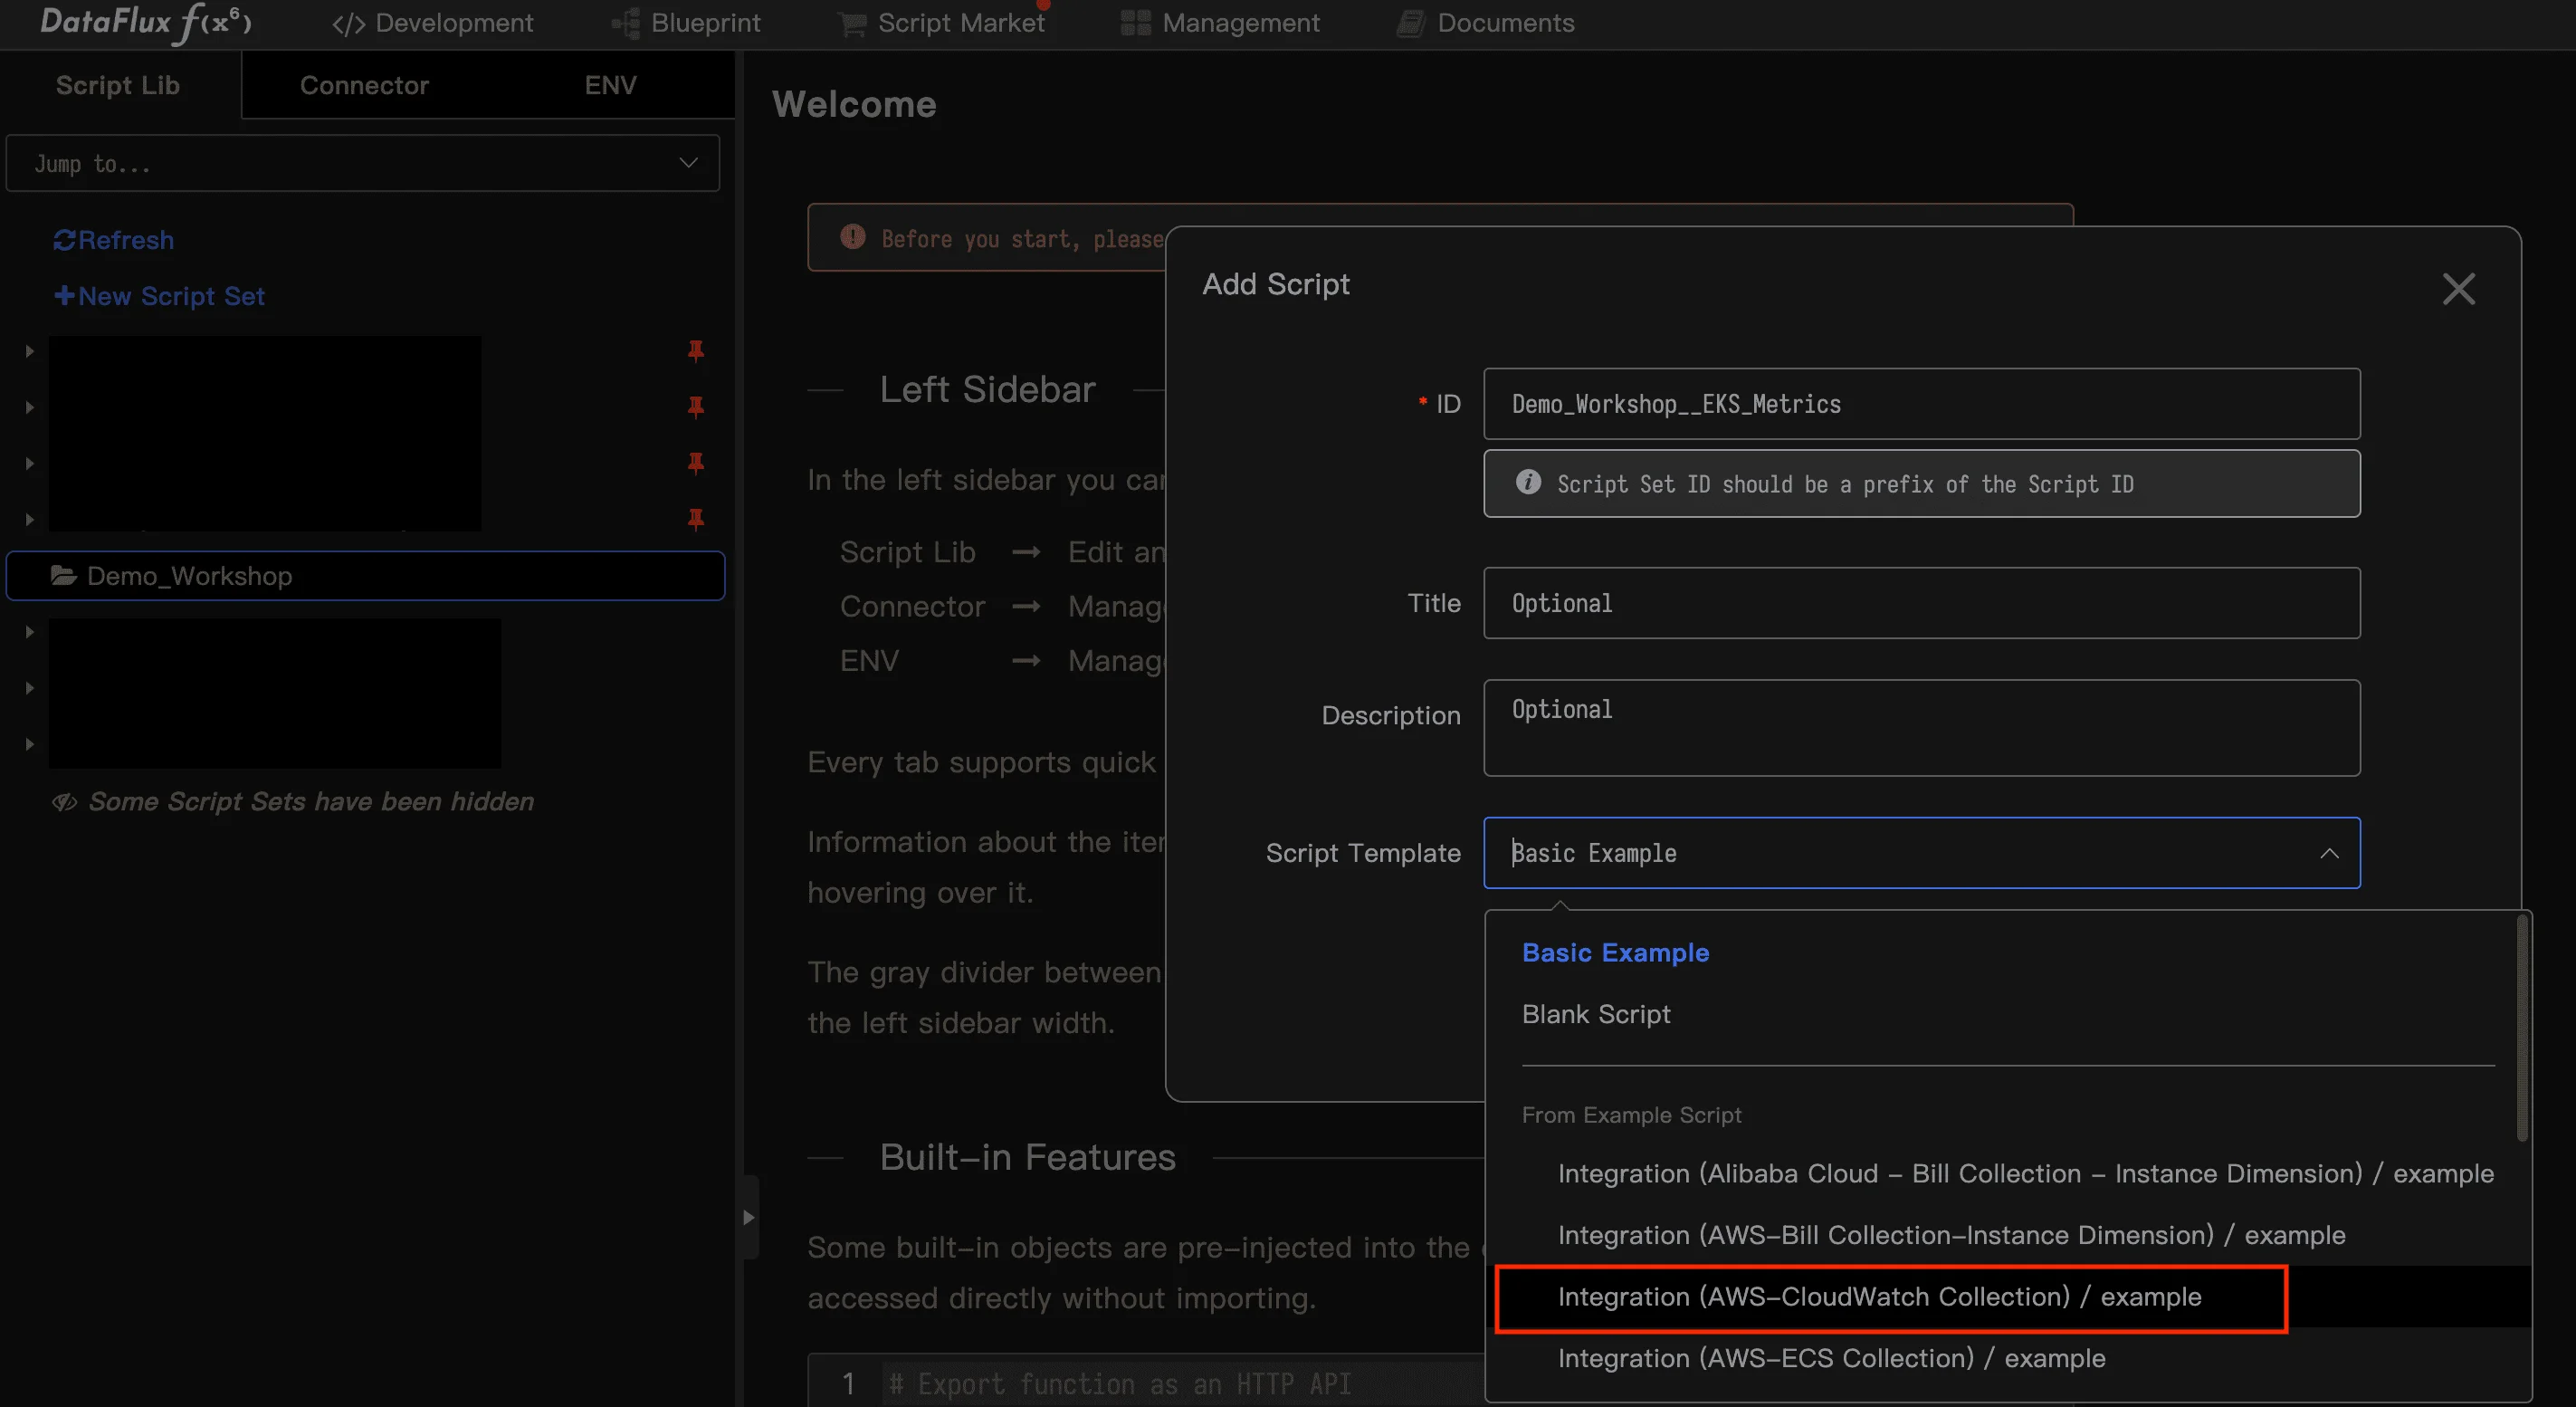
4.6 Attach the Market Script
- In Add Script pop‑up, give your script an ID and select the installed script, e.g.,
Integration (AWS-CloudWatch Collection) / example, then click Save.
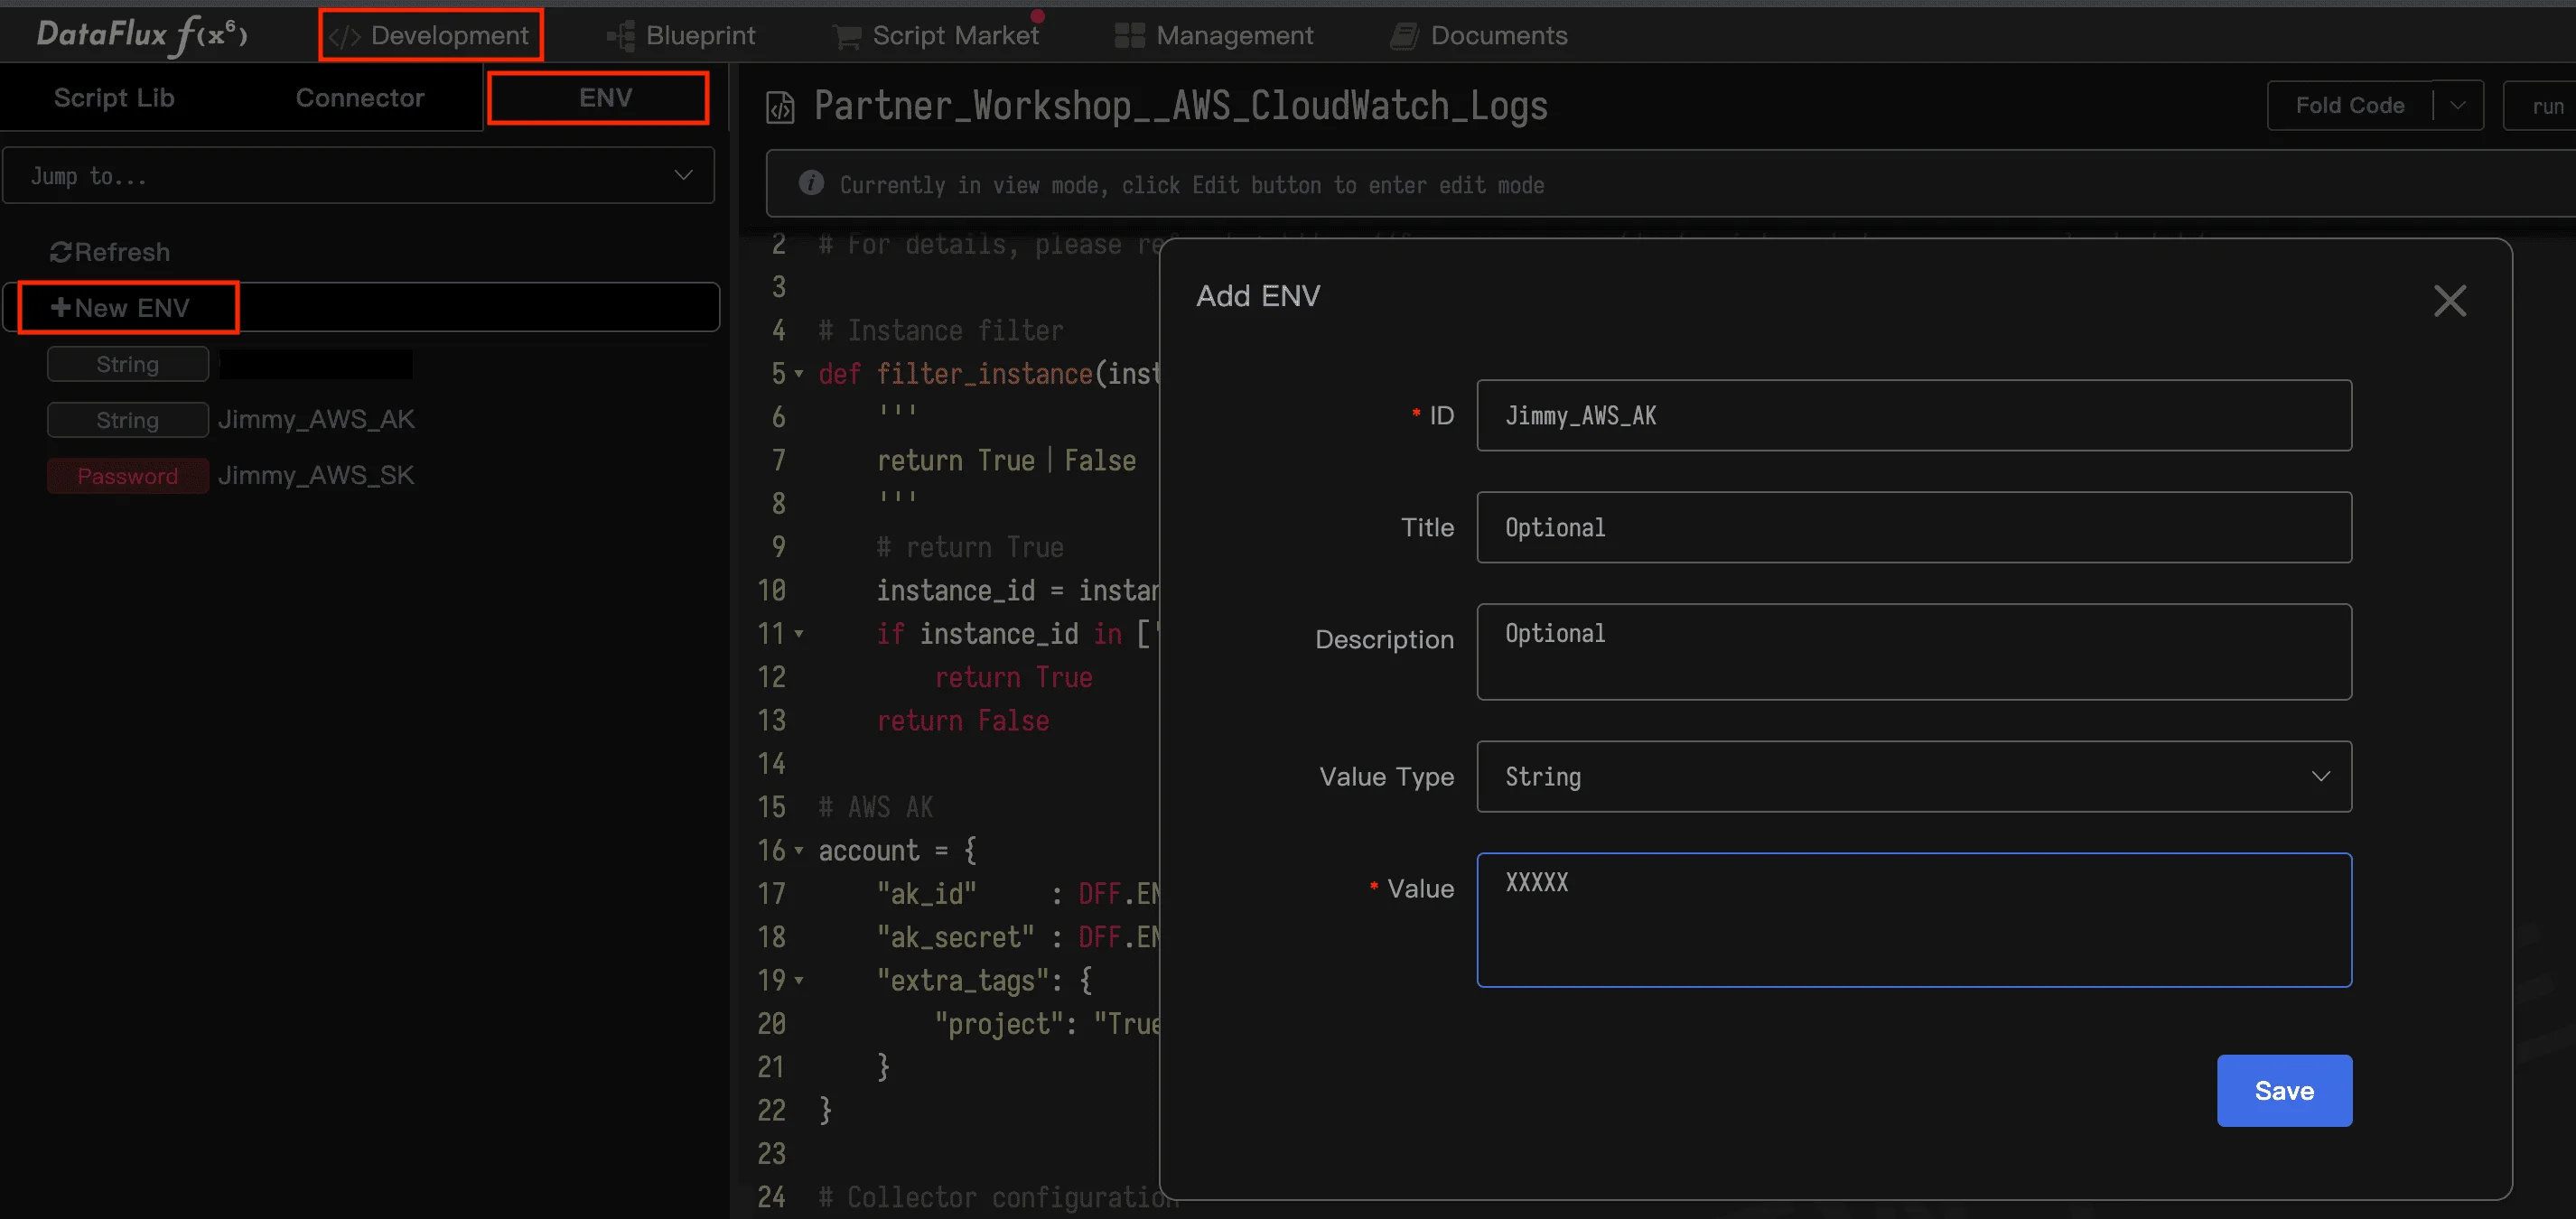
4.7 Create ENV with AWS Credentials
- Go to Development → ENV tab, click + New ENV, and furnish fields with your AWS Access key and Secret key.
- For Secret key, set Value Type = Password so it’s masked. Save the ENV.
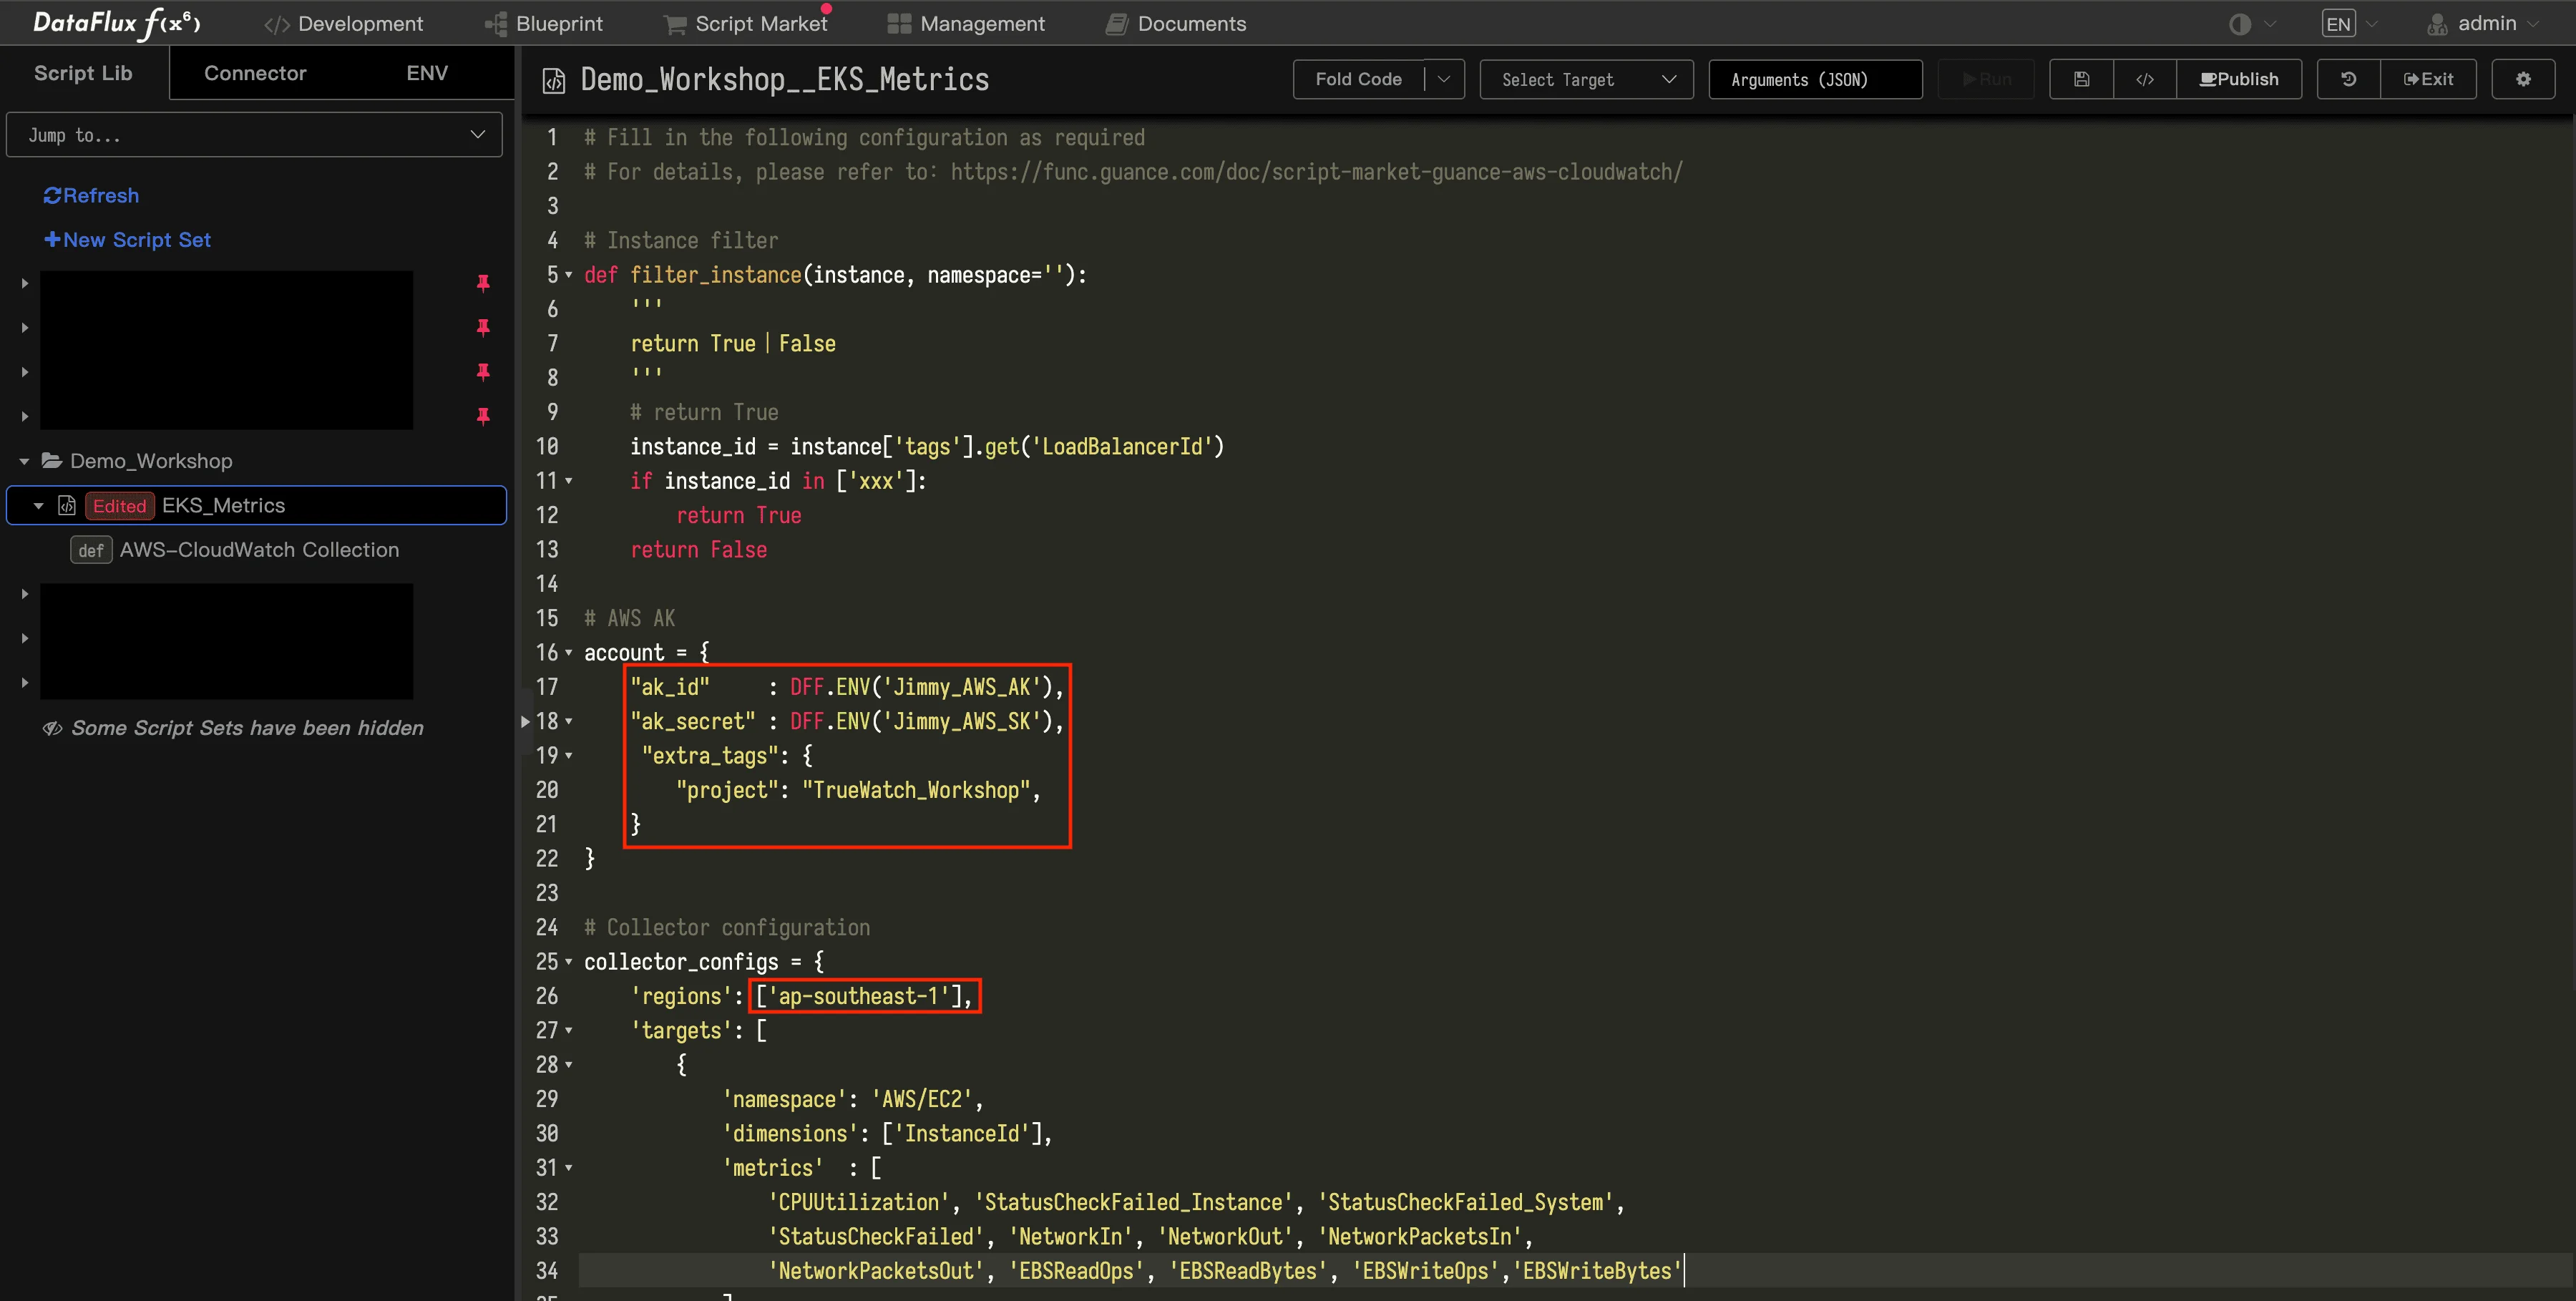
4.8 Edit Script Parameters and Publish
- Open Script Lib →
Demo_Workshop→EKS_Metrics(your script) and click Edit. - Replace line 17 & 18 with references to the ENV variables you created.
- Update or remove lines 19–25 per your needs (e.g., metric namespaces, filters, tag keys).
- Set the region on line 26 to your AWS region. Optionally add tags (as shown around lines 19–21).
- Click Publish, confirm, and (optionally) Run to test.
Tip: Use tags to keep dashboards tidy (e.g.,
env=dev,team=platform,account=prod).
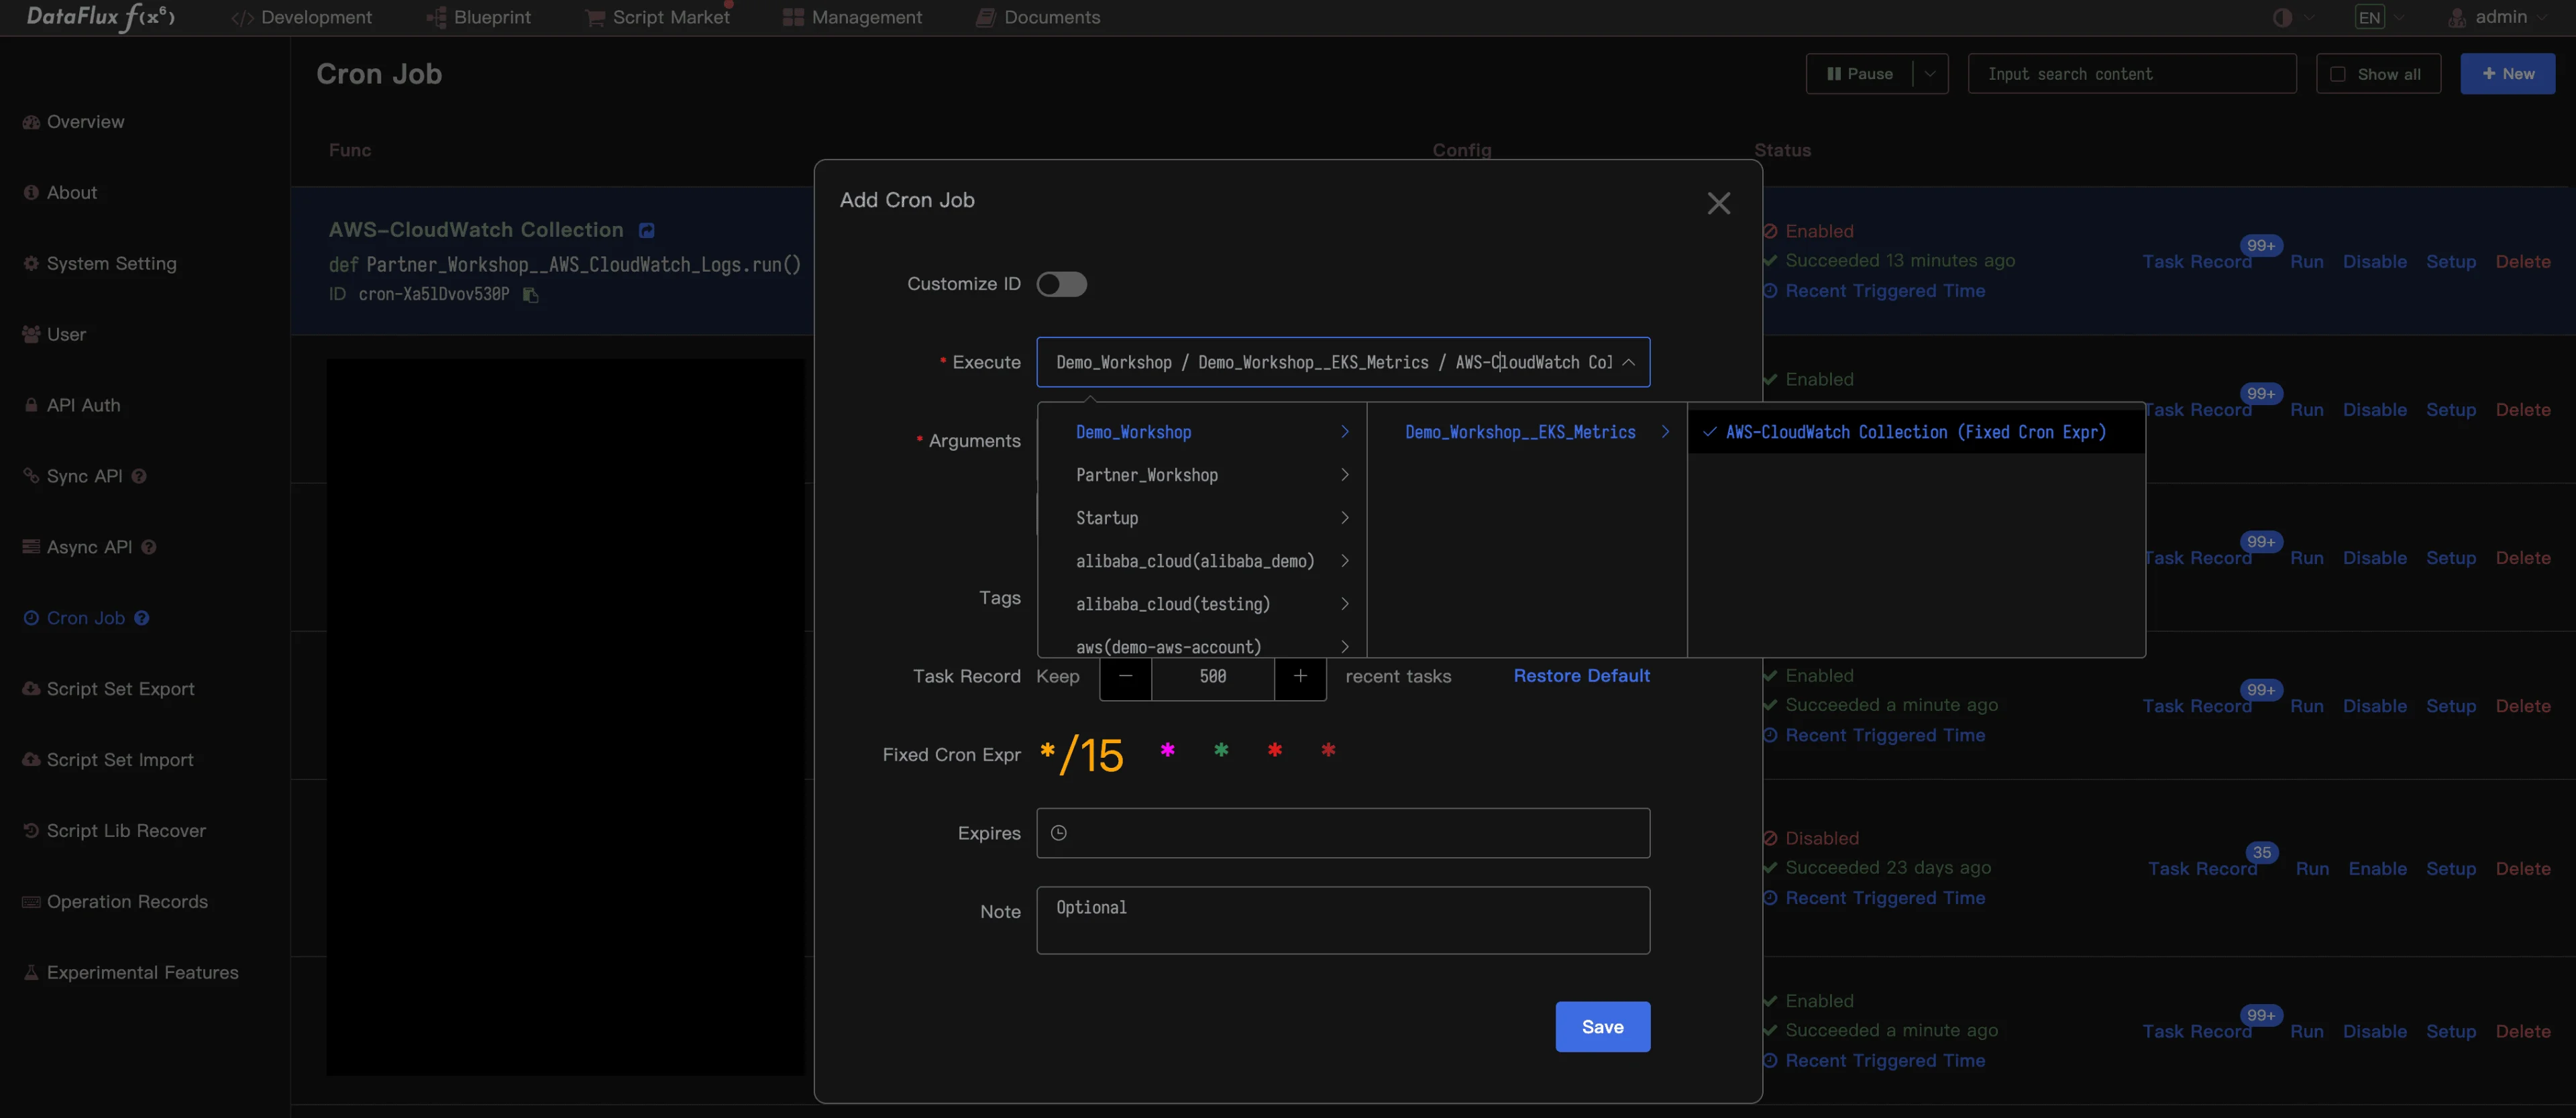
4.9 Schedule the Script with a Cron Job
- Go to Management → Cron Job, click + New.
- Under Execute, select your published script (e.g.,
Demo_Workshop__EKS_Metrics). Leave defaults; click Save.
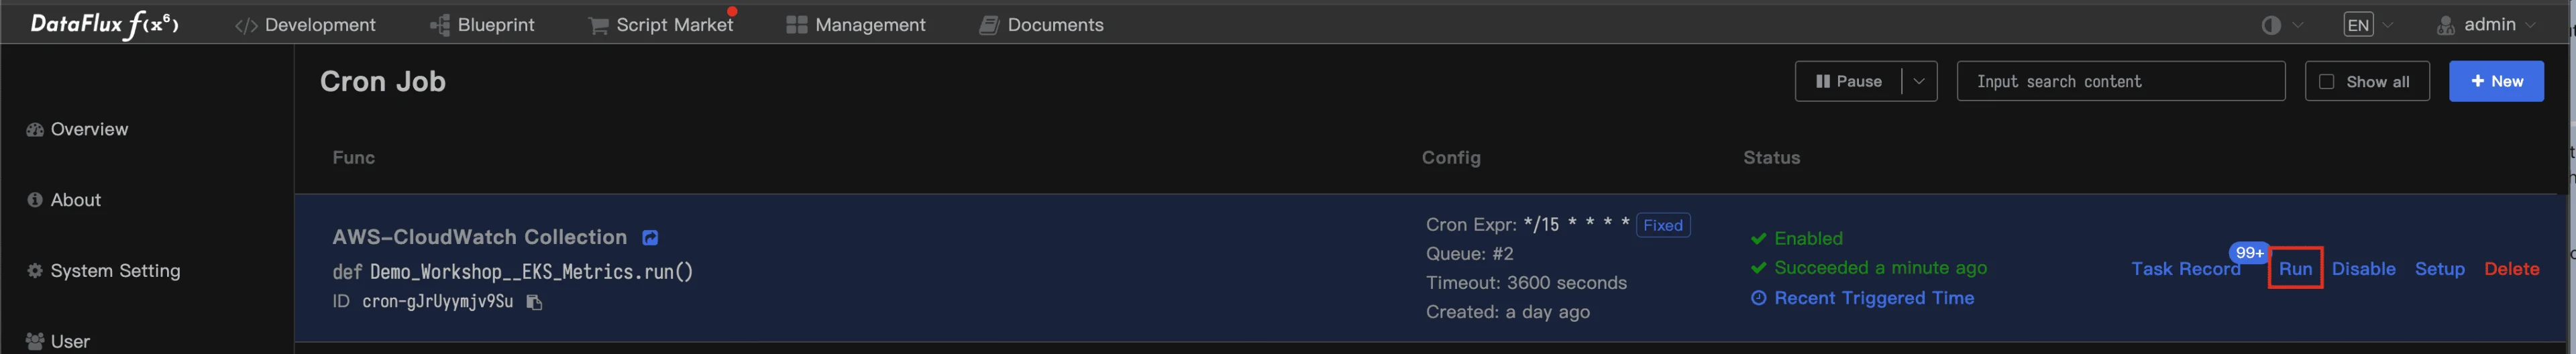
4.10 Trigger the First Run
- You should now see your new Cron job. Click Run to execute the script immediately.
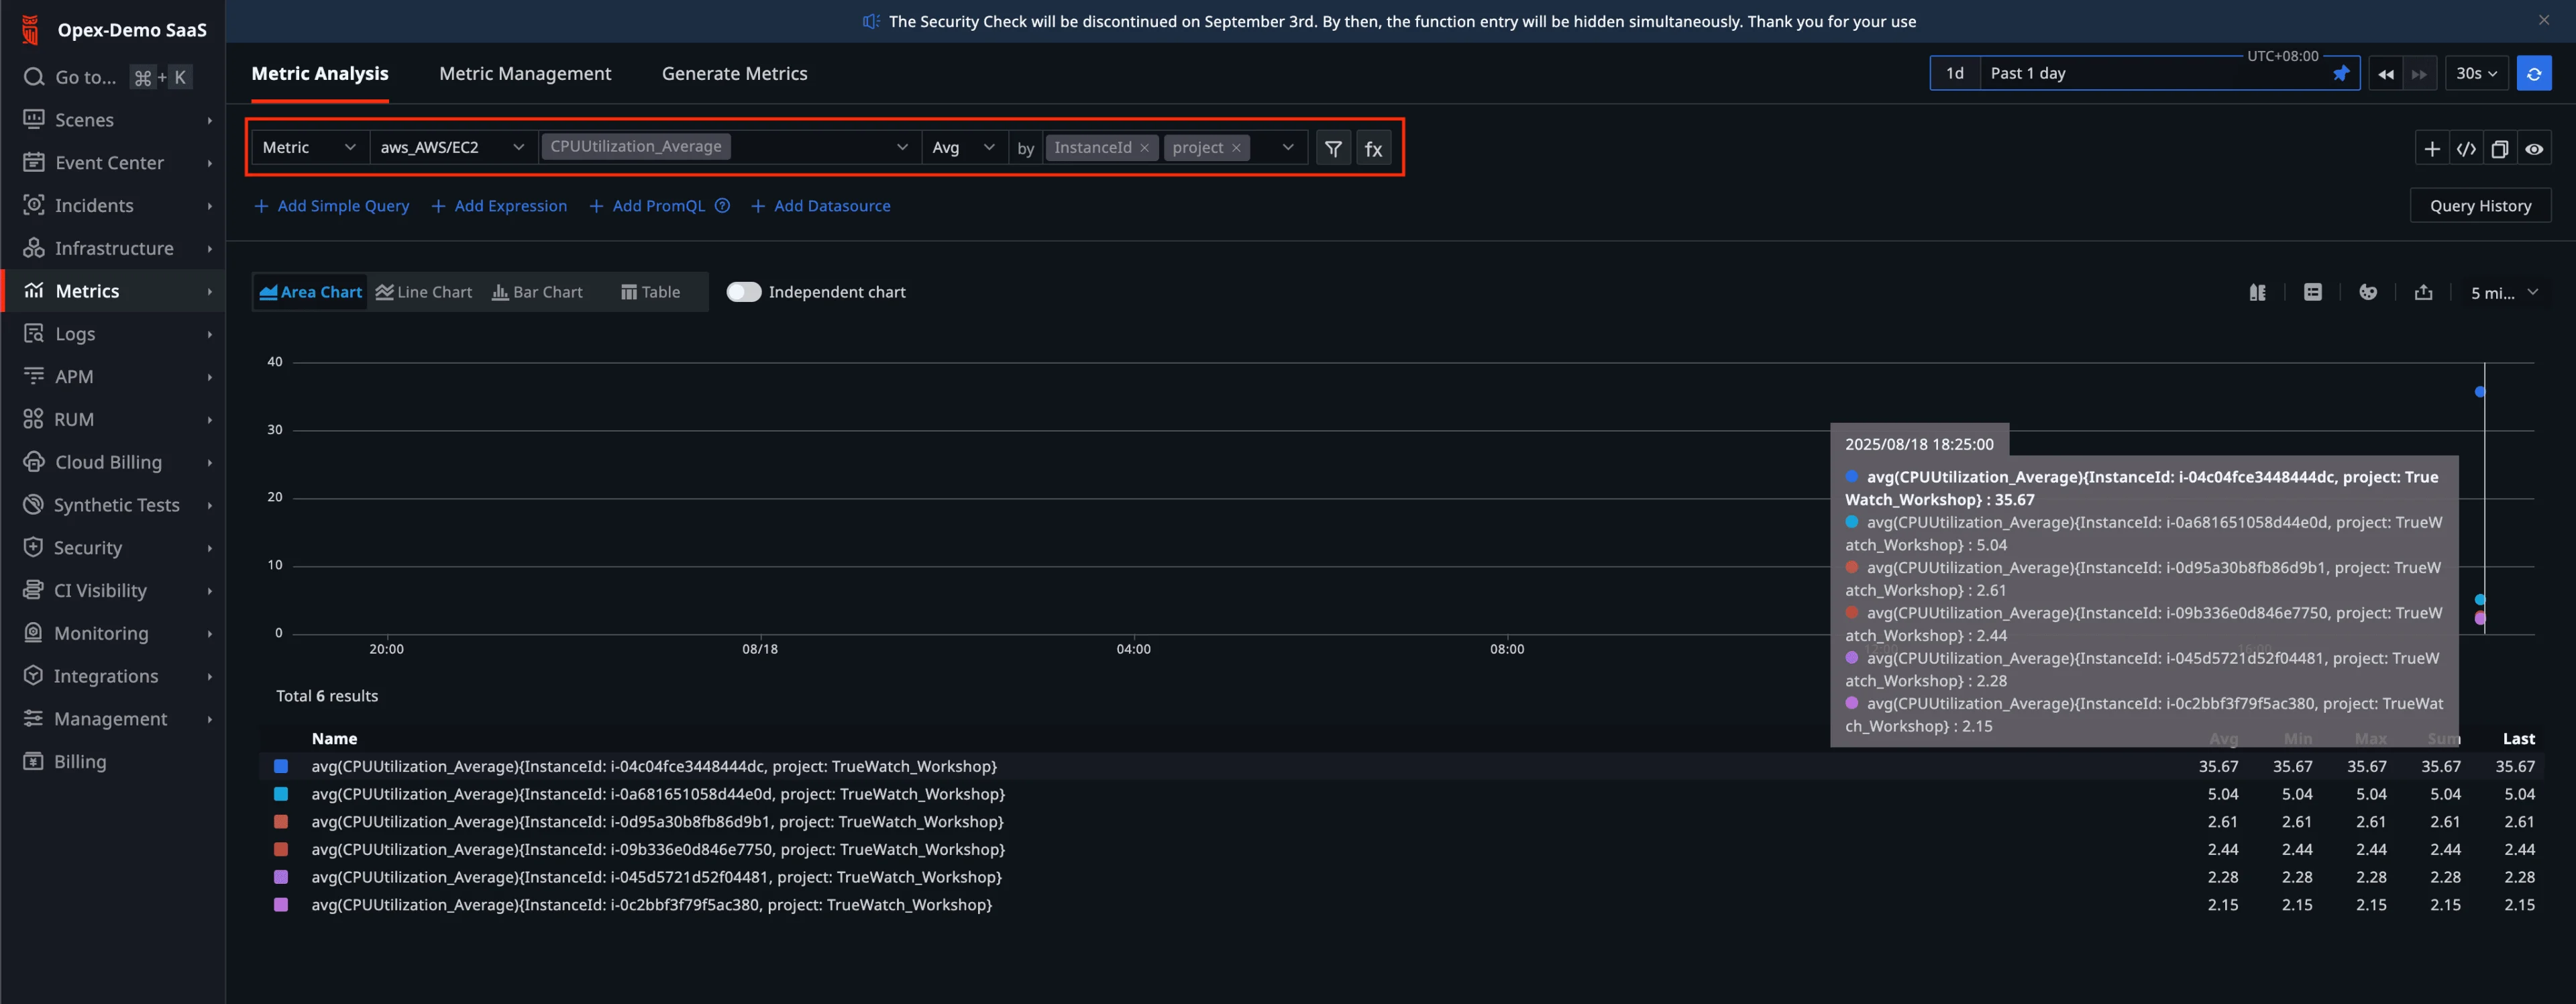
5. Validate Metrics in TrueWatch
5.1 Metric Analysis
- Navigate to Metrics → Metric Analysis. Recreate the query shown in your screenshot to confirm data points are flowing.
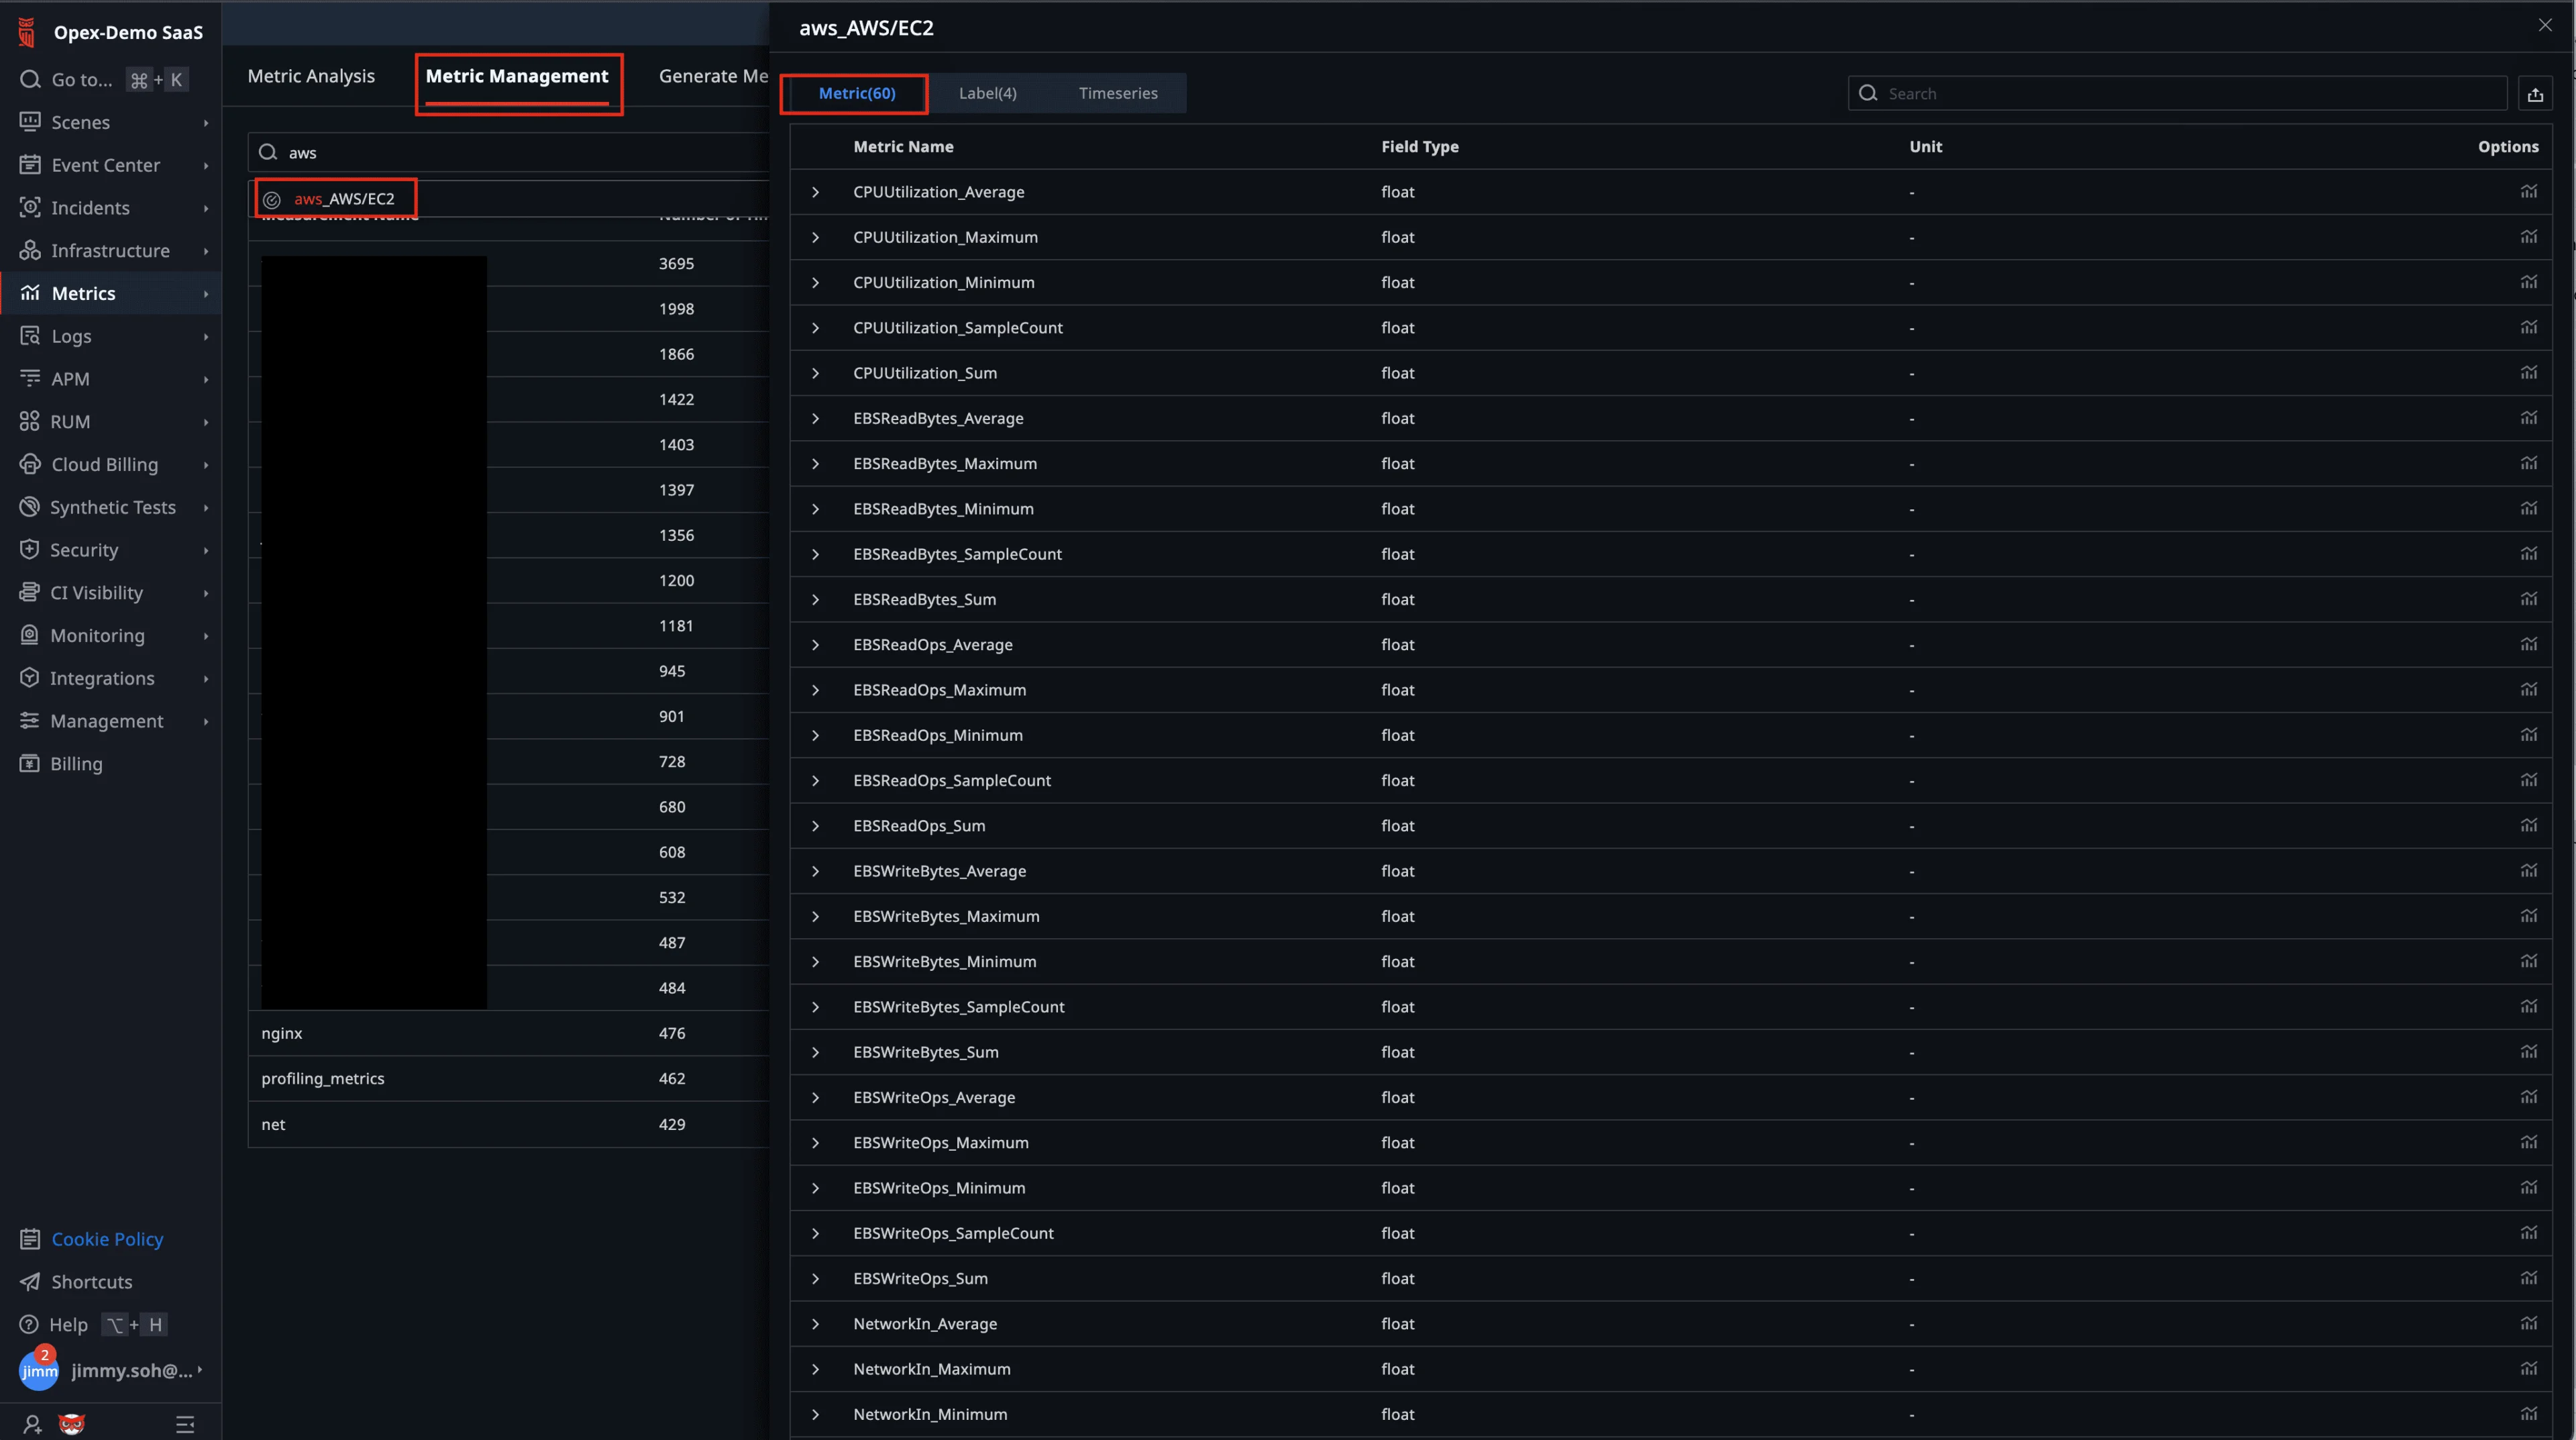
5.2 Metrics Management
- Open Metrics → Metrics Management and filter by
aws_AWS/EC2. You should see all collected metrics and field types.
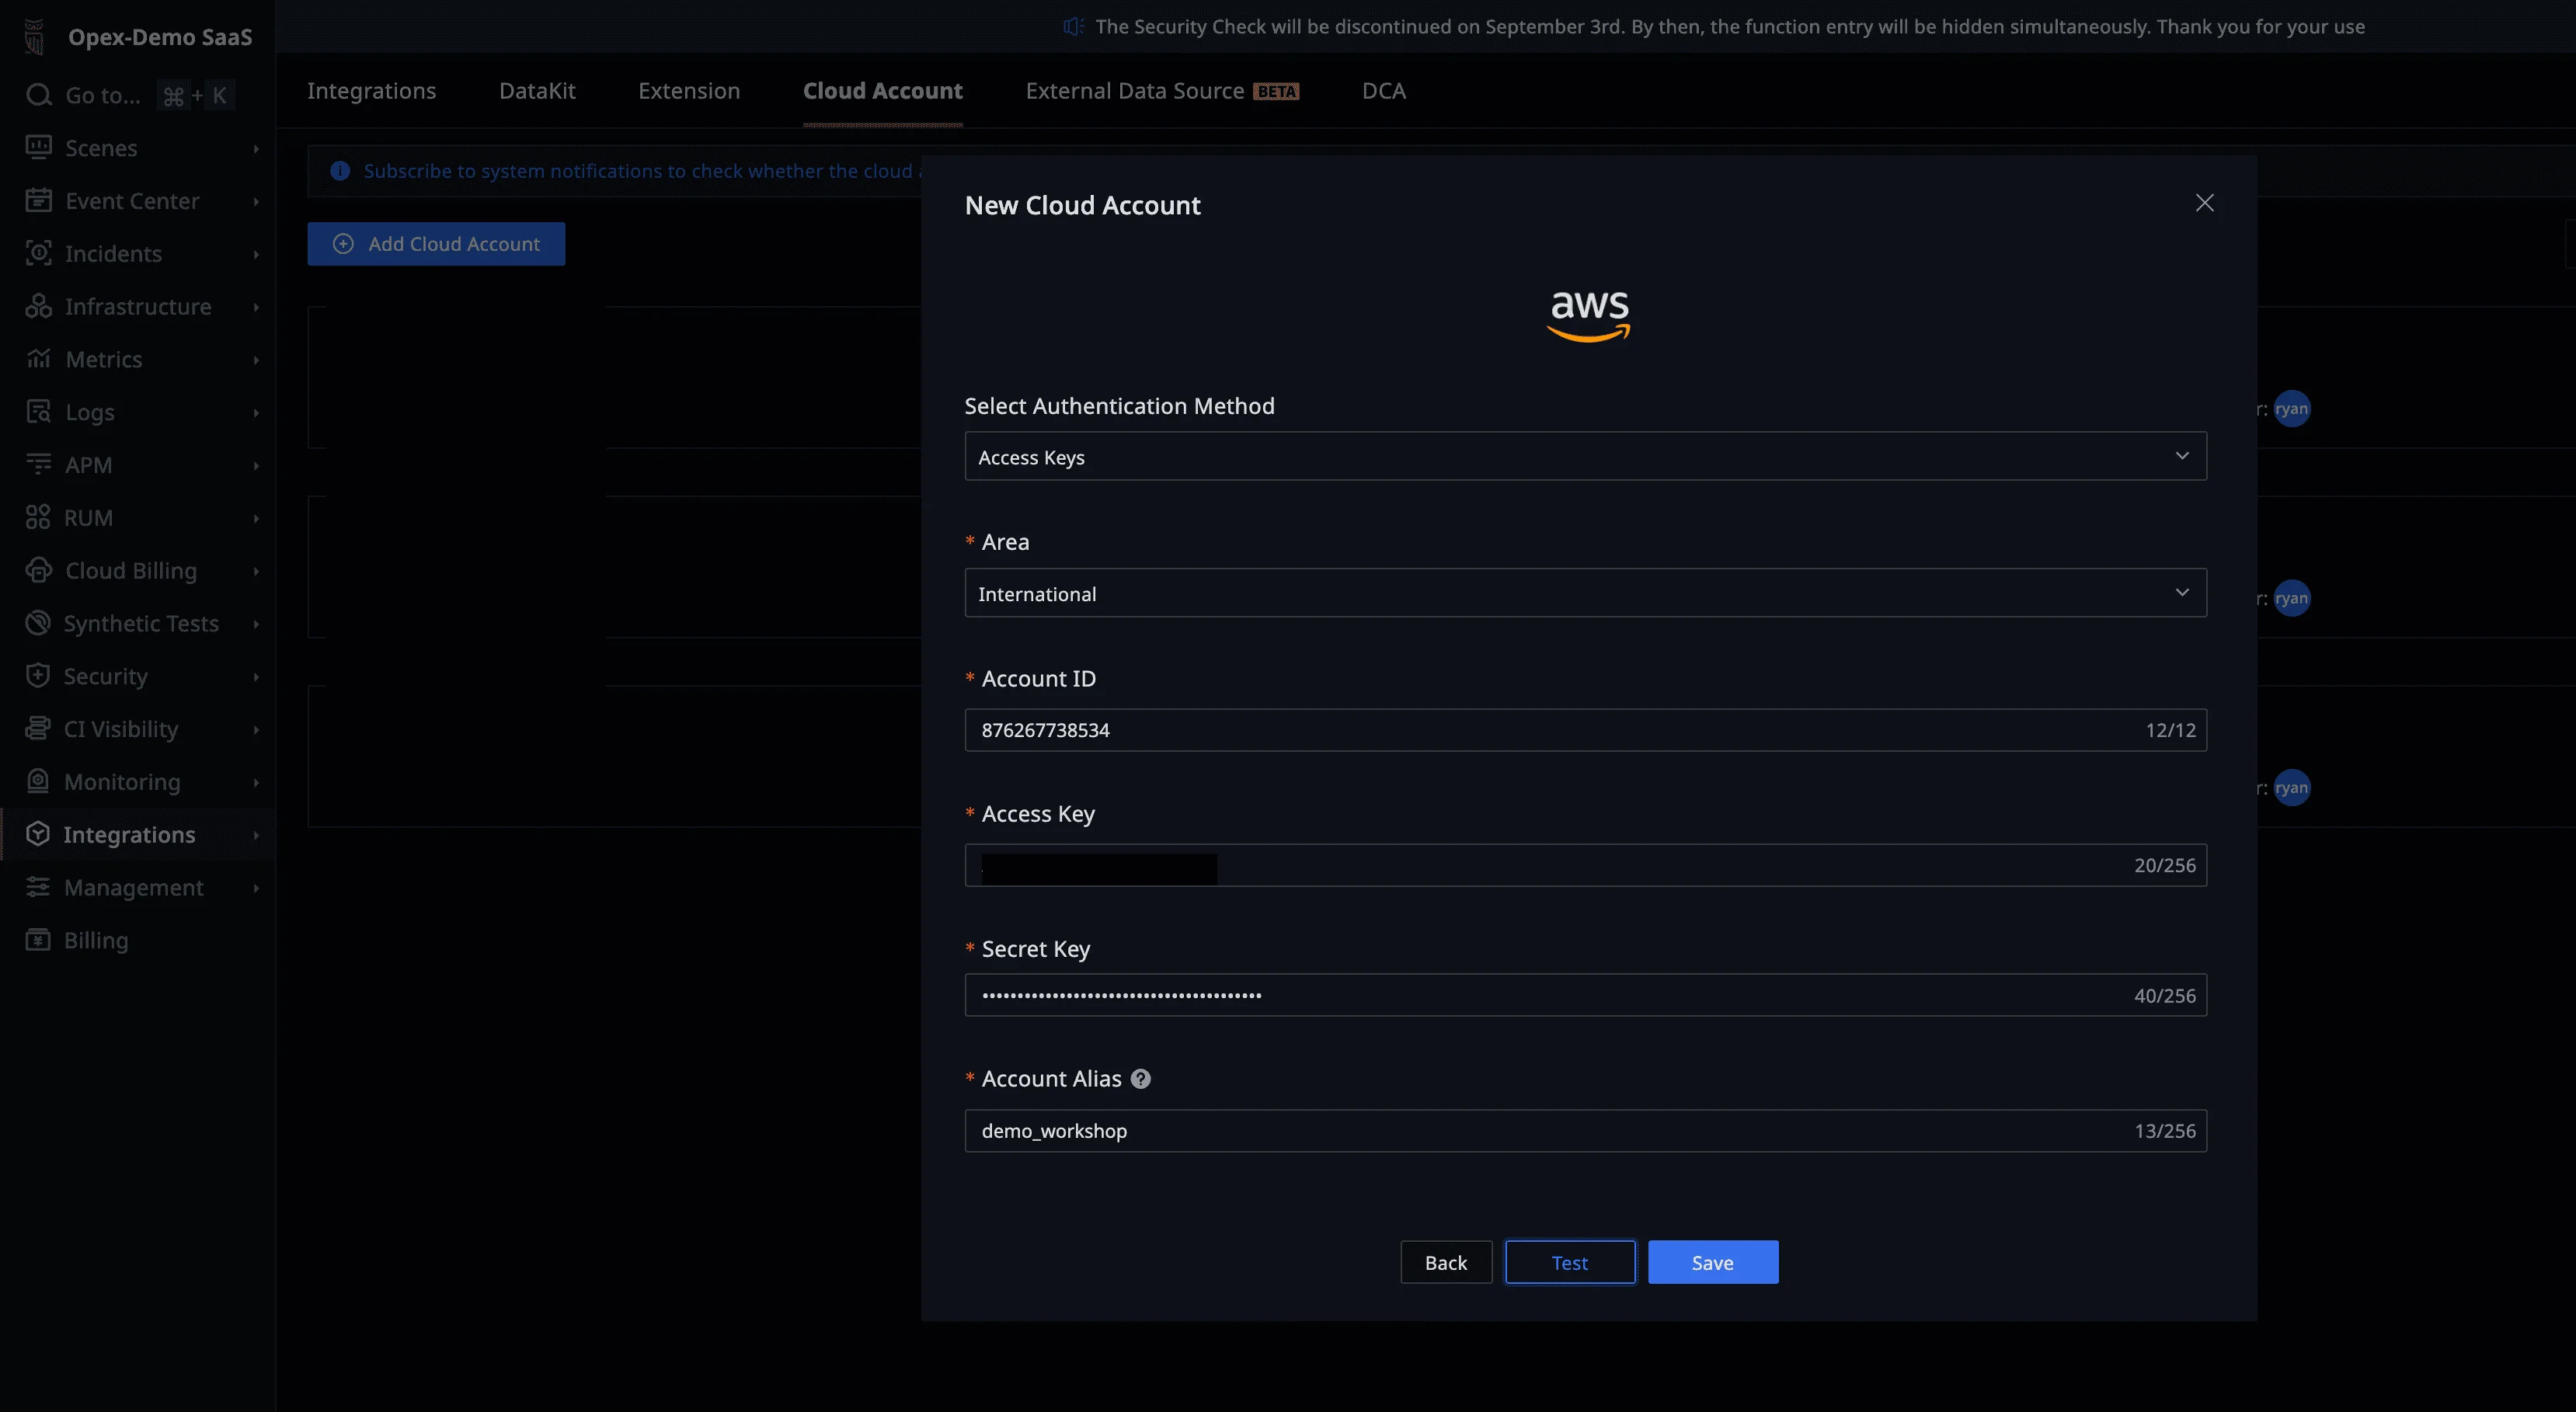
6. Add AWS Cloud Billing Account
6.1 Connect the Account
- In TrueWatch, go to Integrations → Cloud Account → Add Cloud Account → AWS and furnish the details as shown. Click Test then Save.
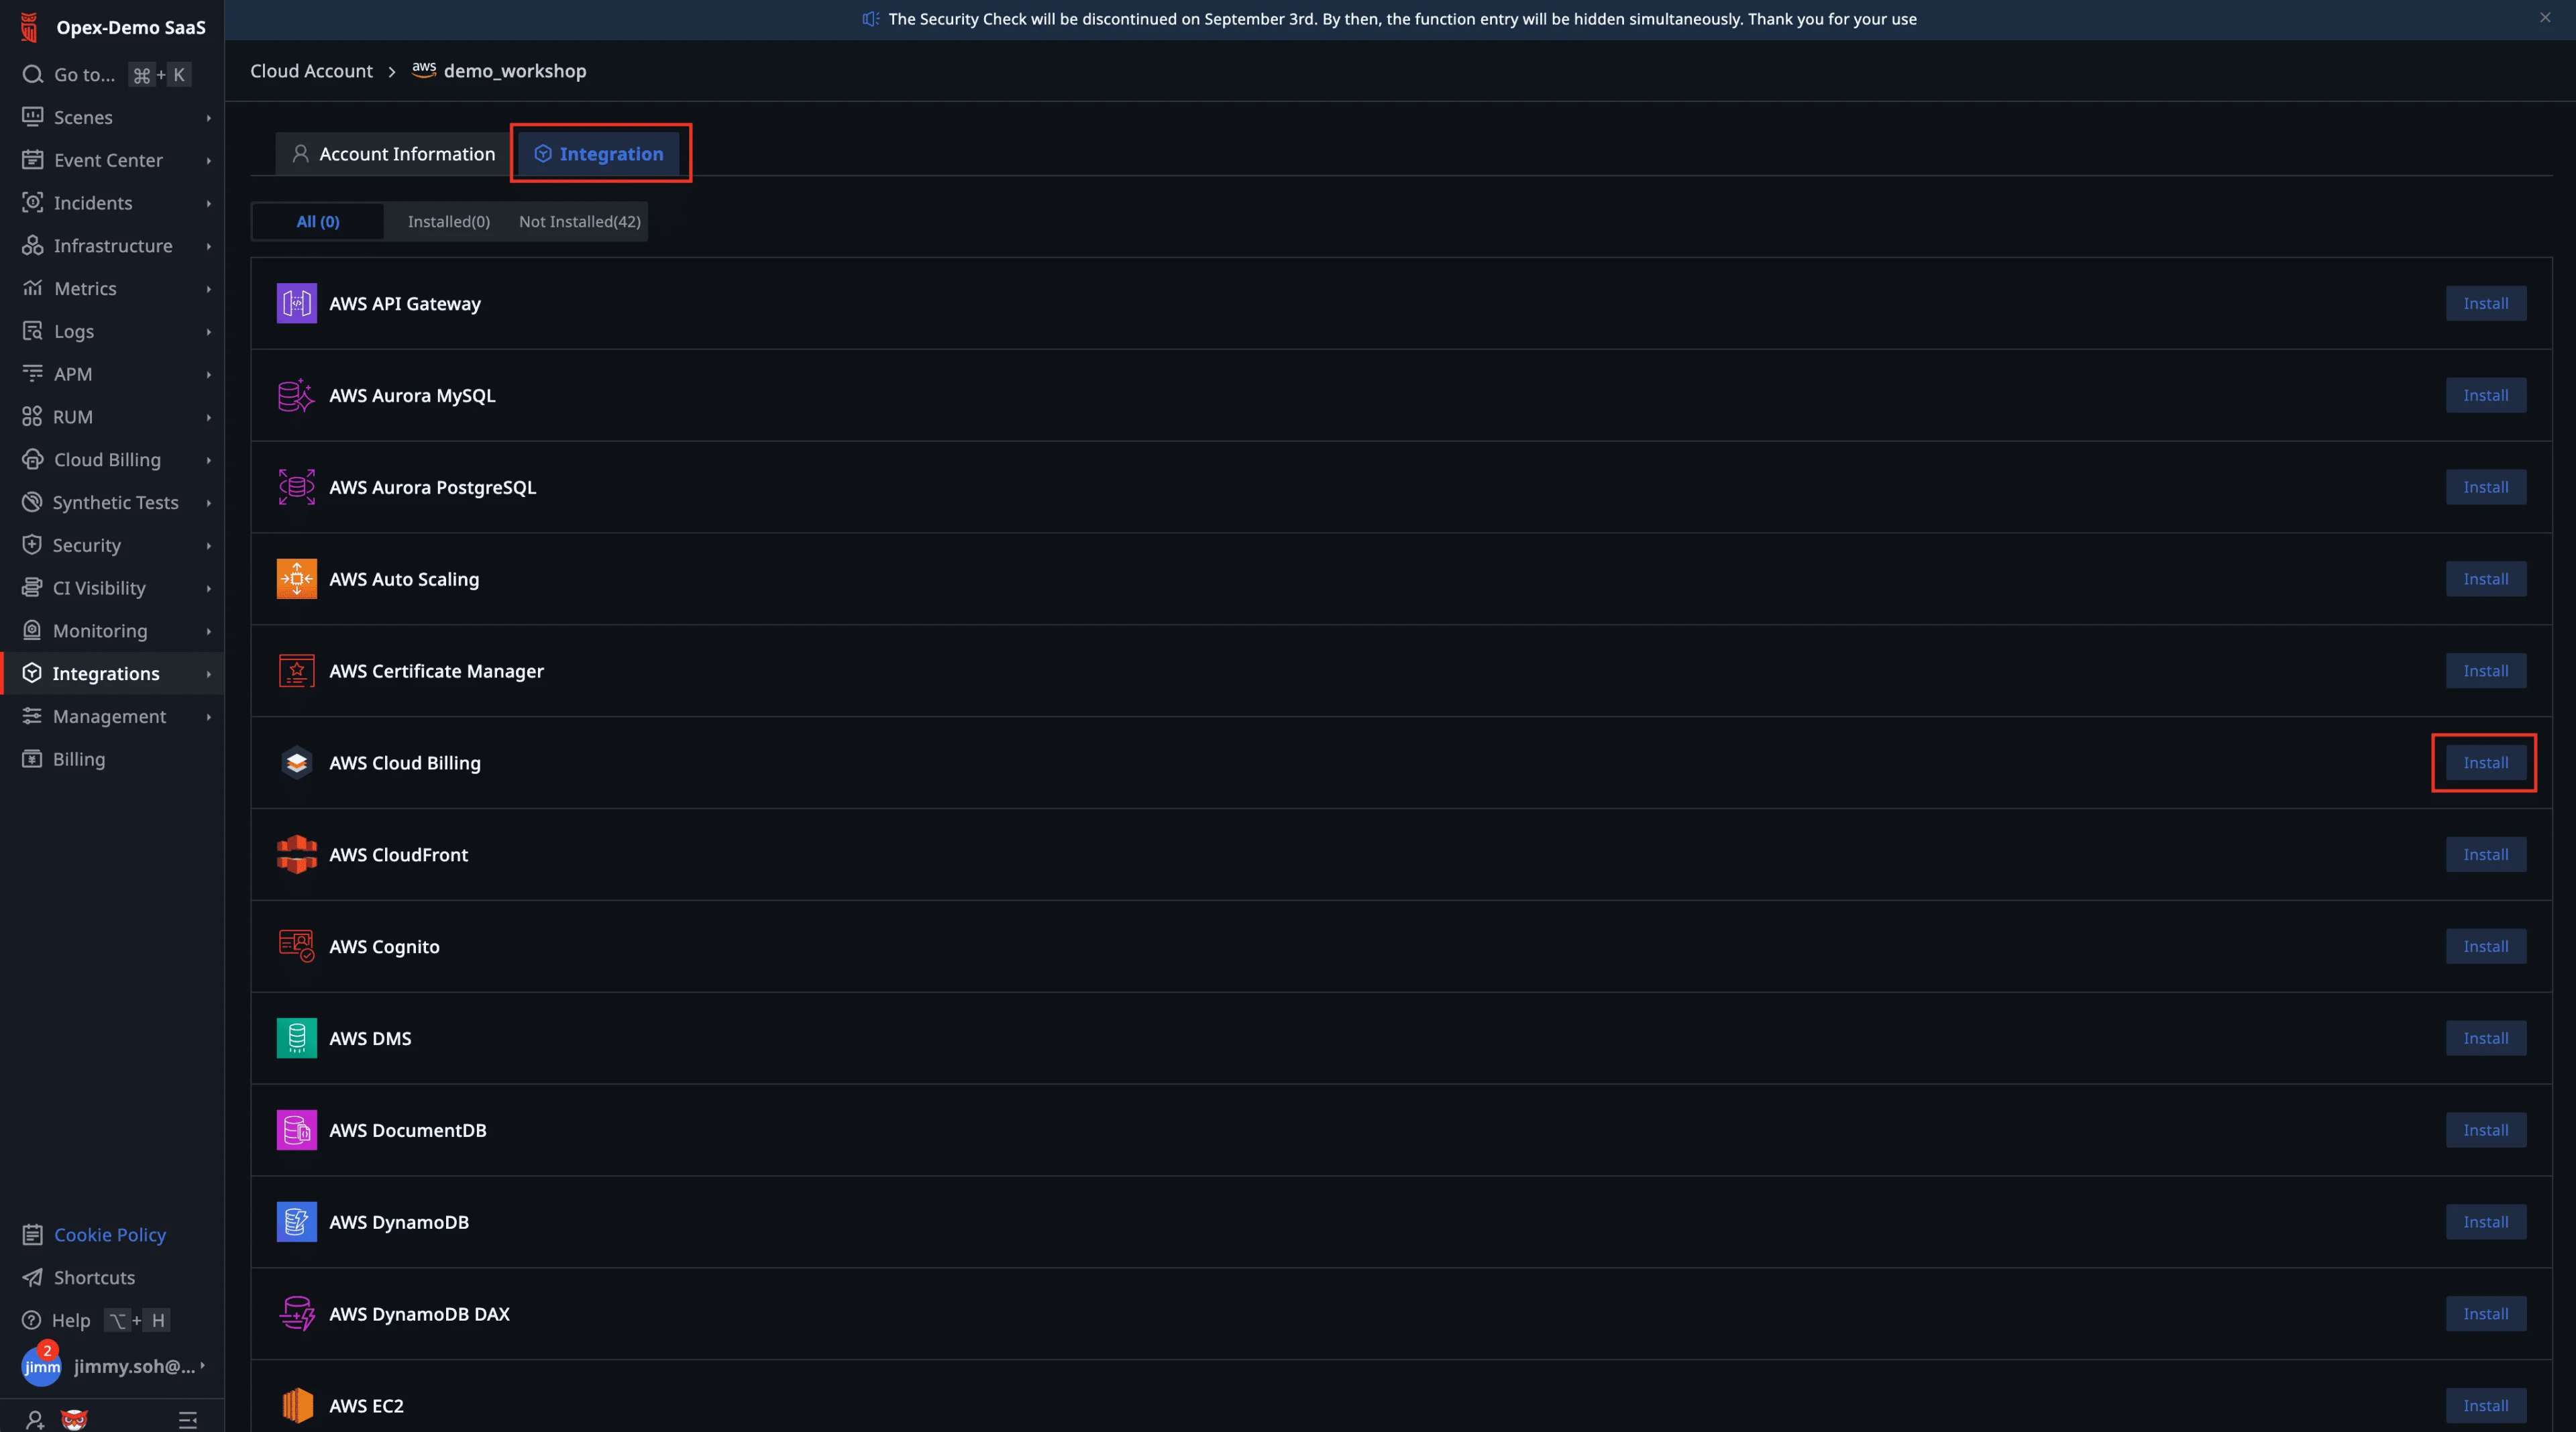
6.2 Install the AWS Cloud Billing Integration
- Enter the newly created cloud account, open Integration tab, and Install AWS Cloud Billing from the list.
6.3 Verify the Auto‑Created Automata Job
- Return to Automata → Management → Cron Job. A new job for billing pull should appear automatically. Click Run to trigger a pull.
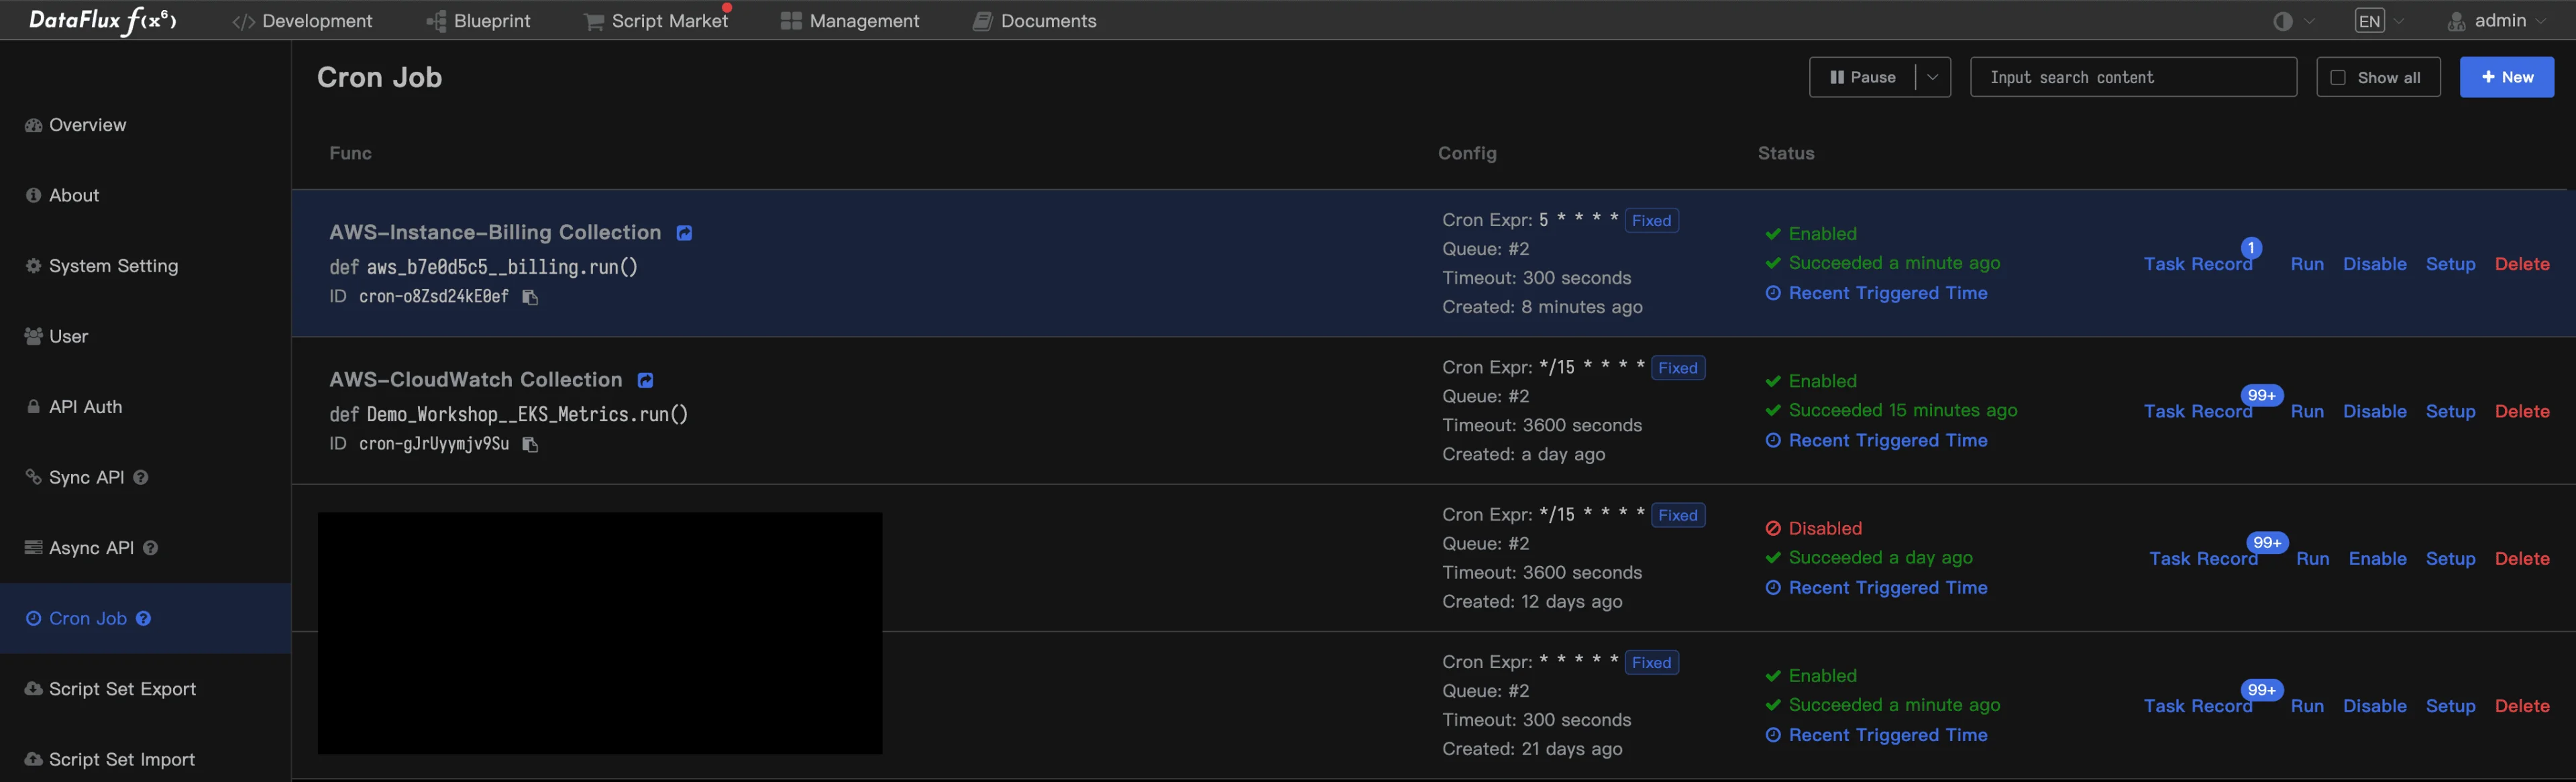
First billing sync can take a few minutes depending on account size and AWS API throttling.
7. View Cost & Build FinOps Dashboards
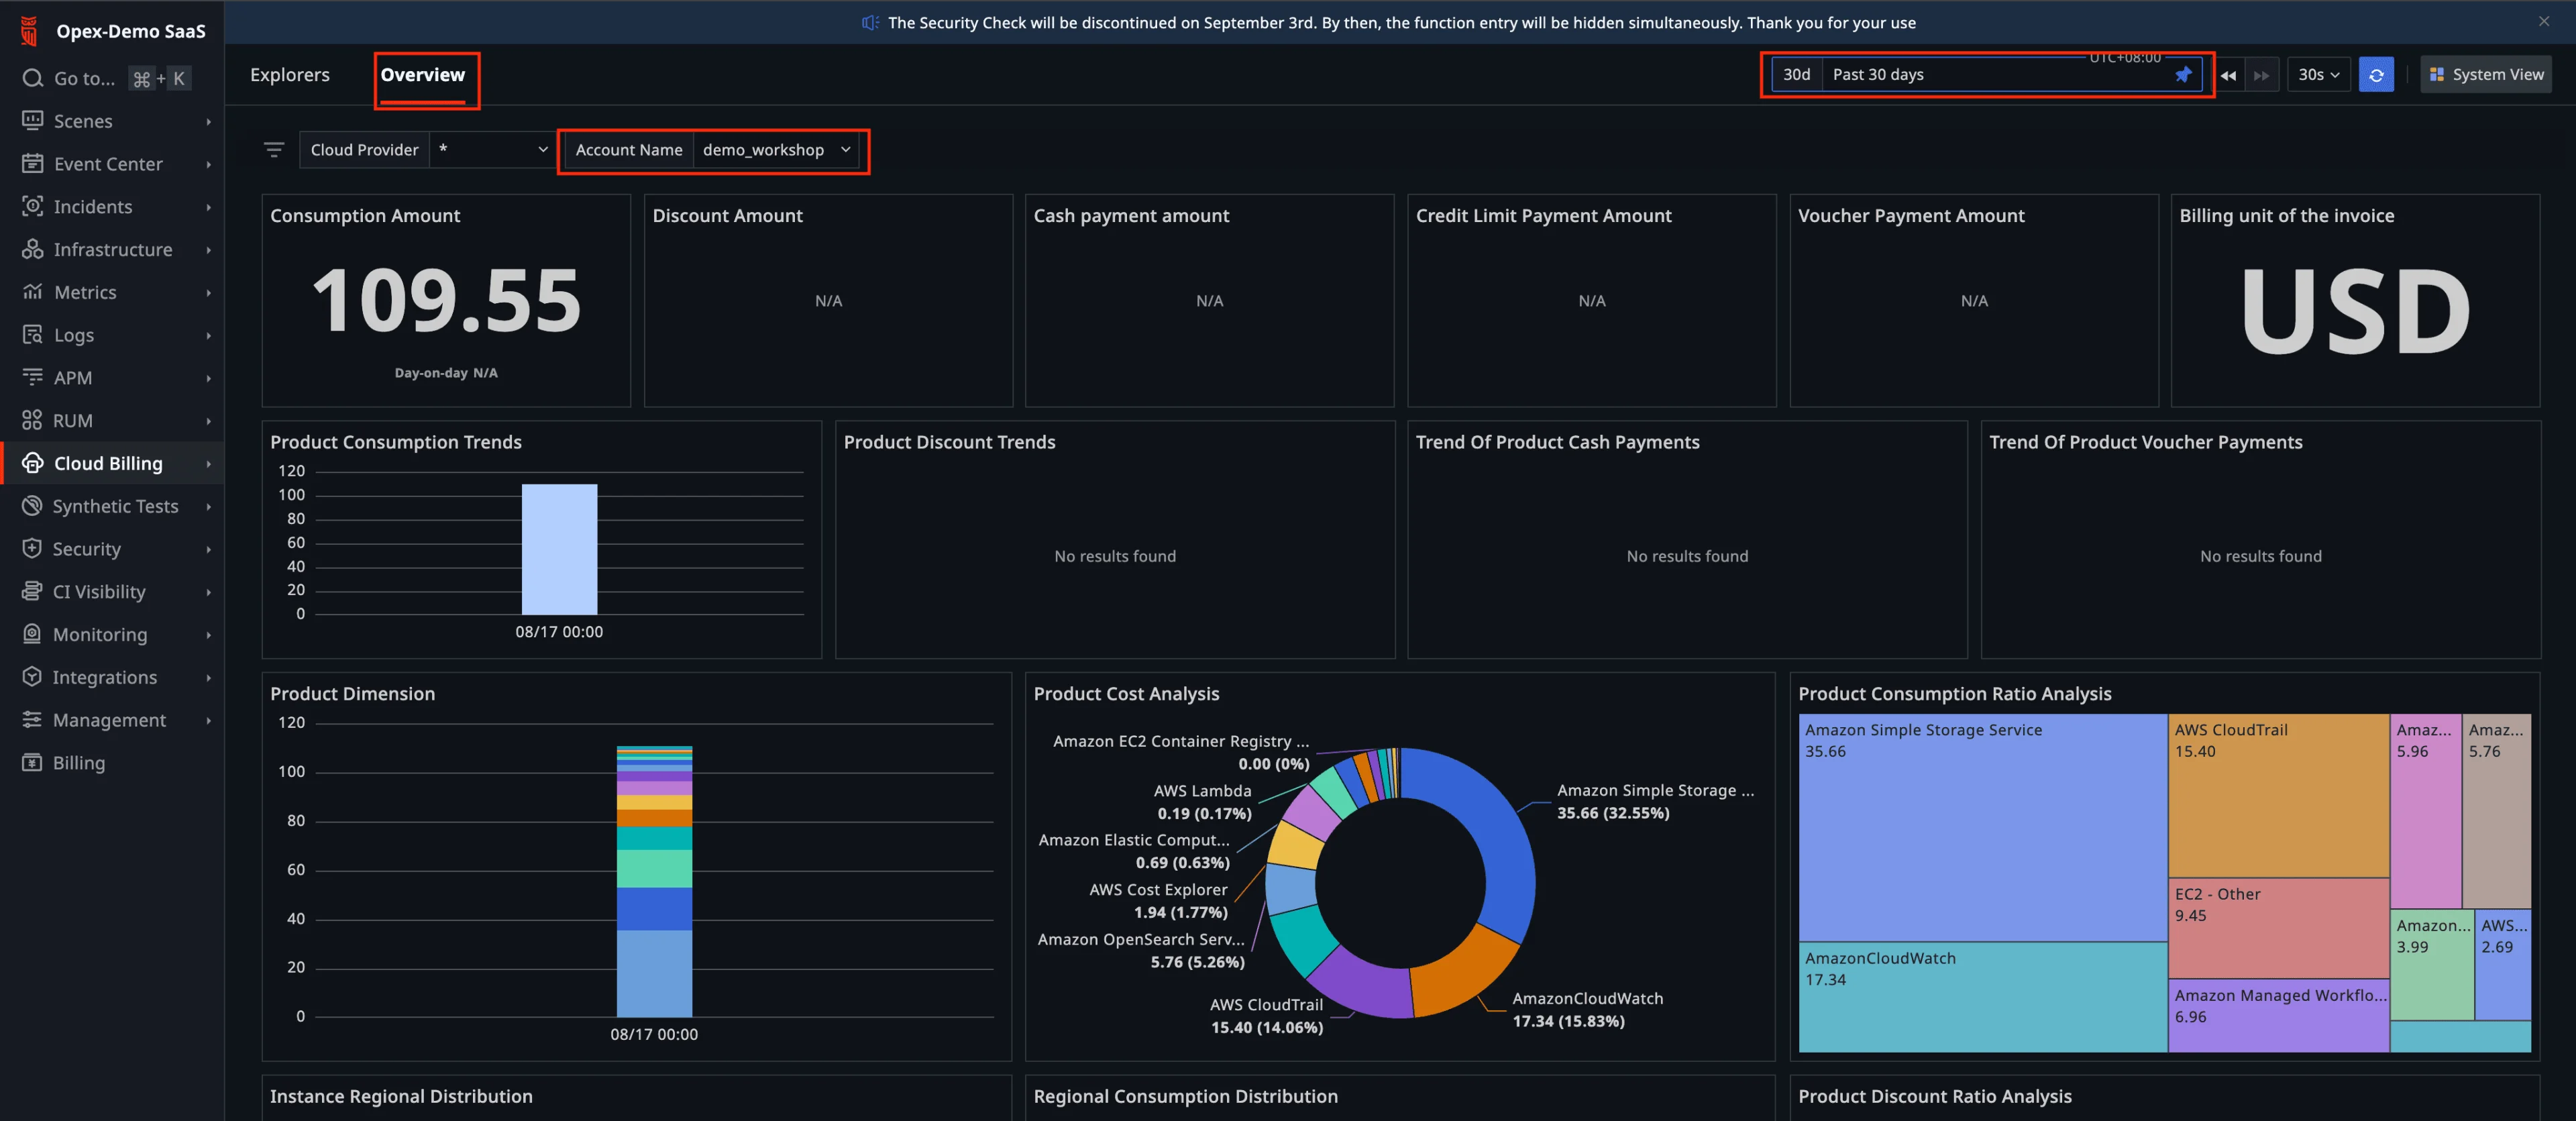
7.1 Explore the Default Billing Overview
- Go to Cloud Billing → Overview. Select Past 30 days and filter by your newly added Account. You’ll see default cost breakdowns.
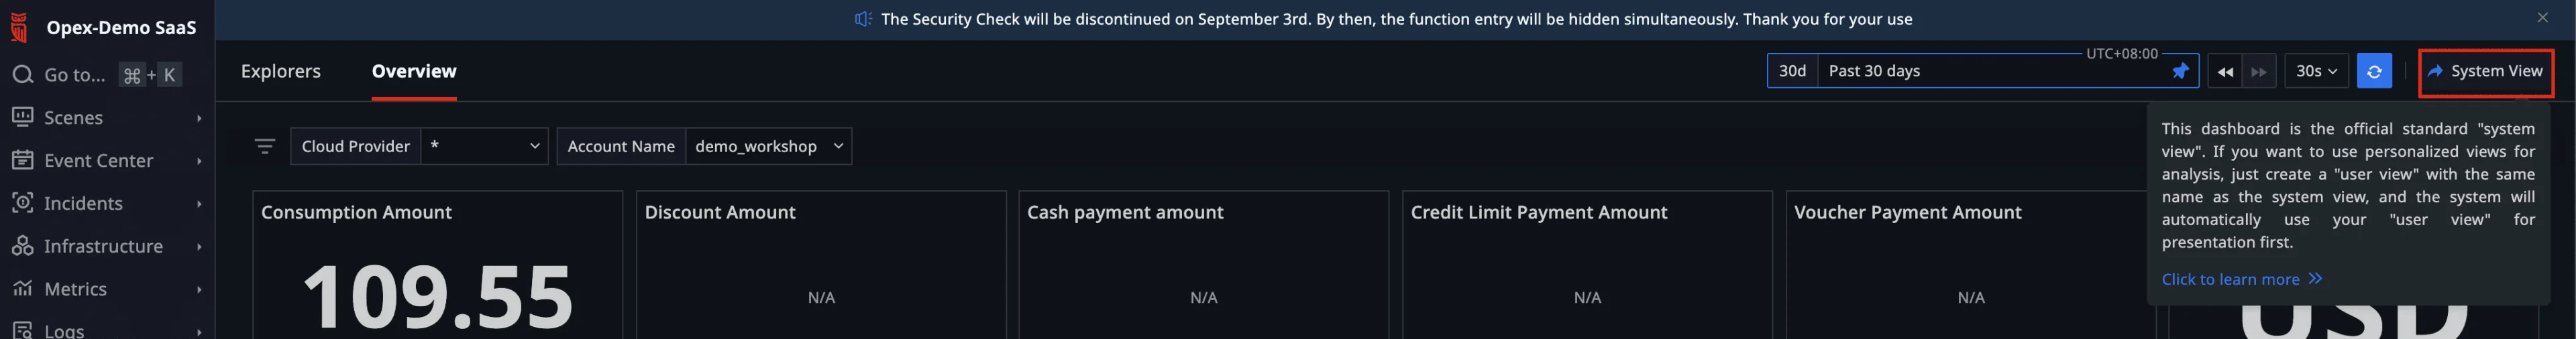
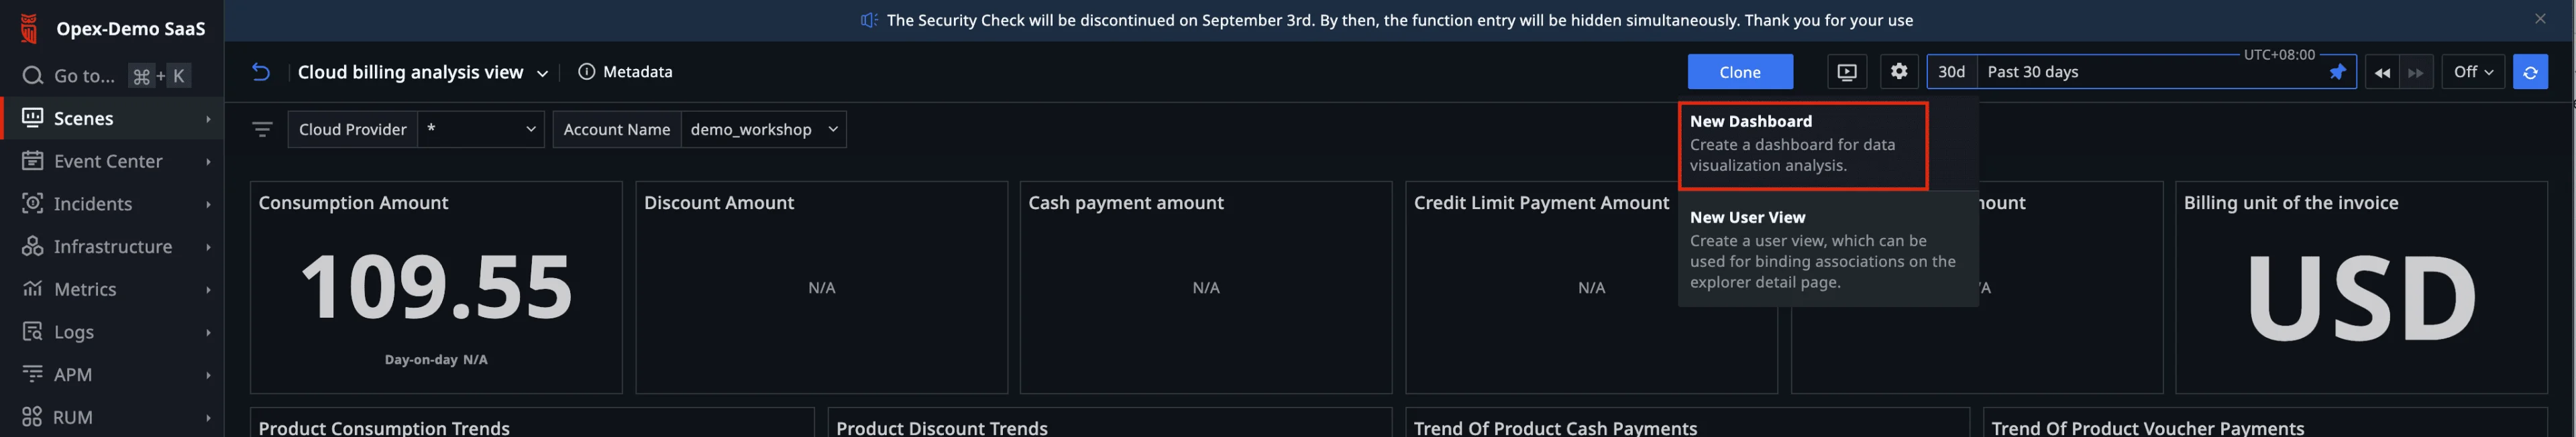
7.2 Clone a System View to Customize
- Click System View (top right).
- Click Clone → New Dashboard, give it a name (e.g., Cloud billing analysis view (Custom)), and Confirm.
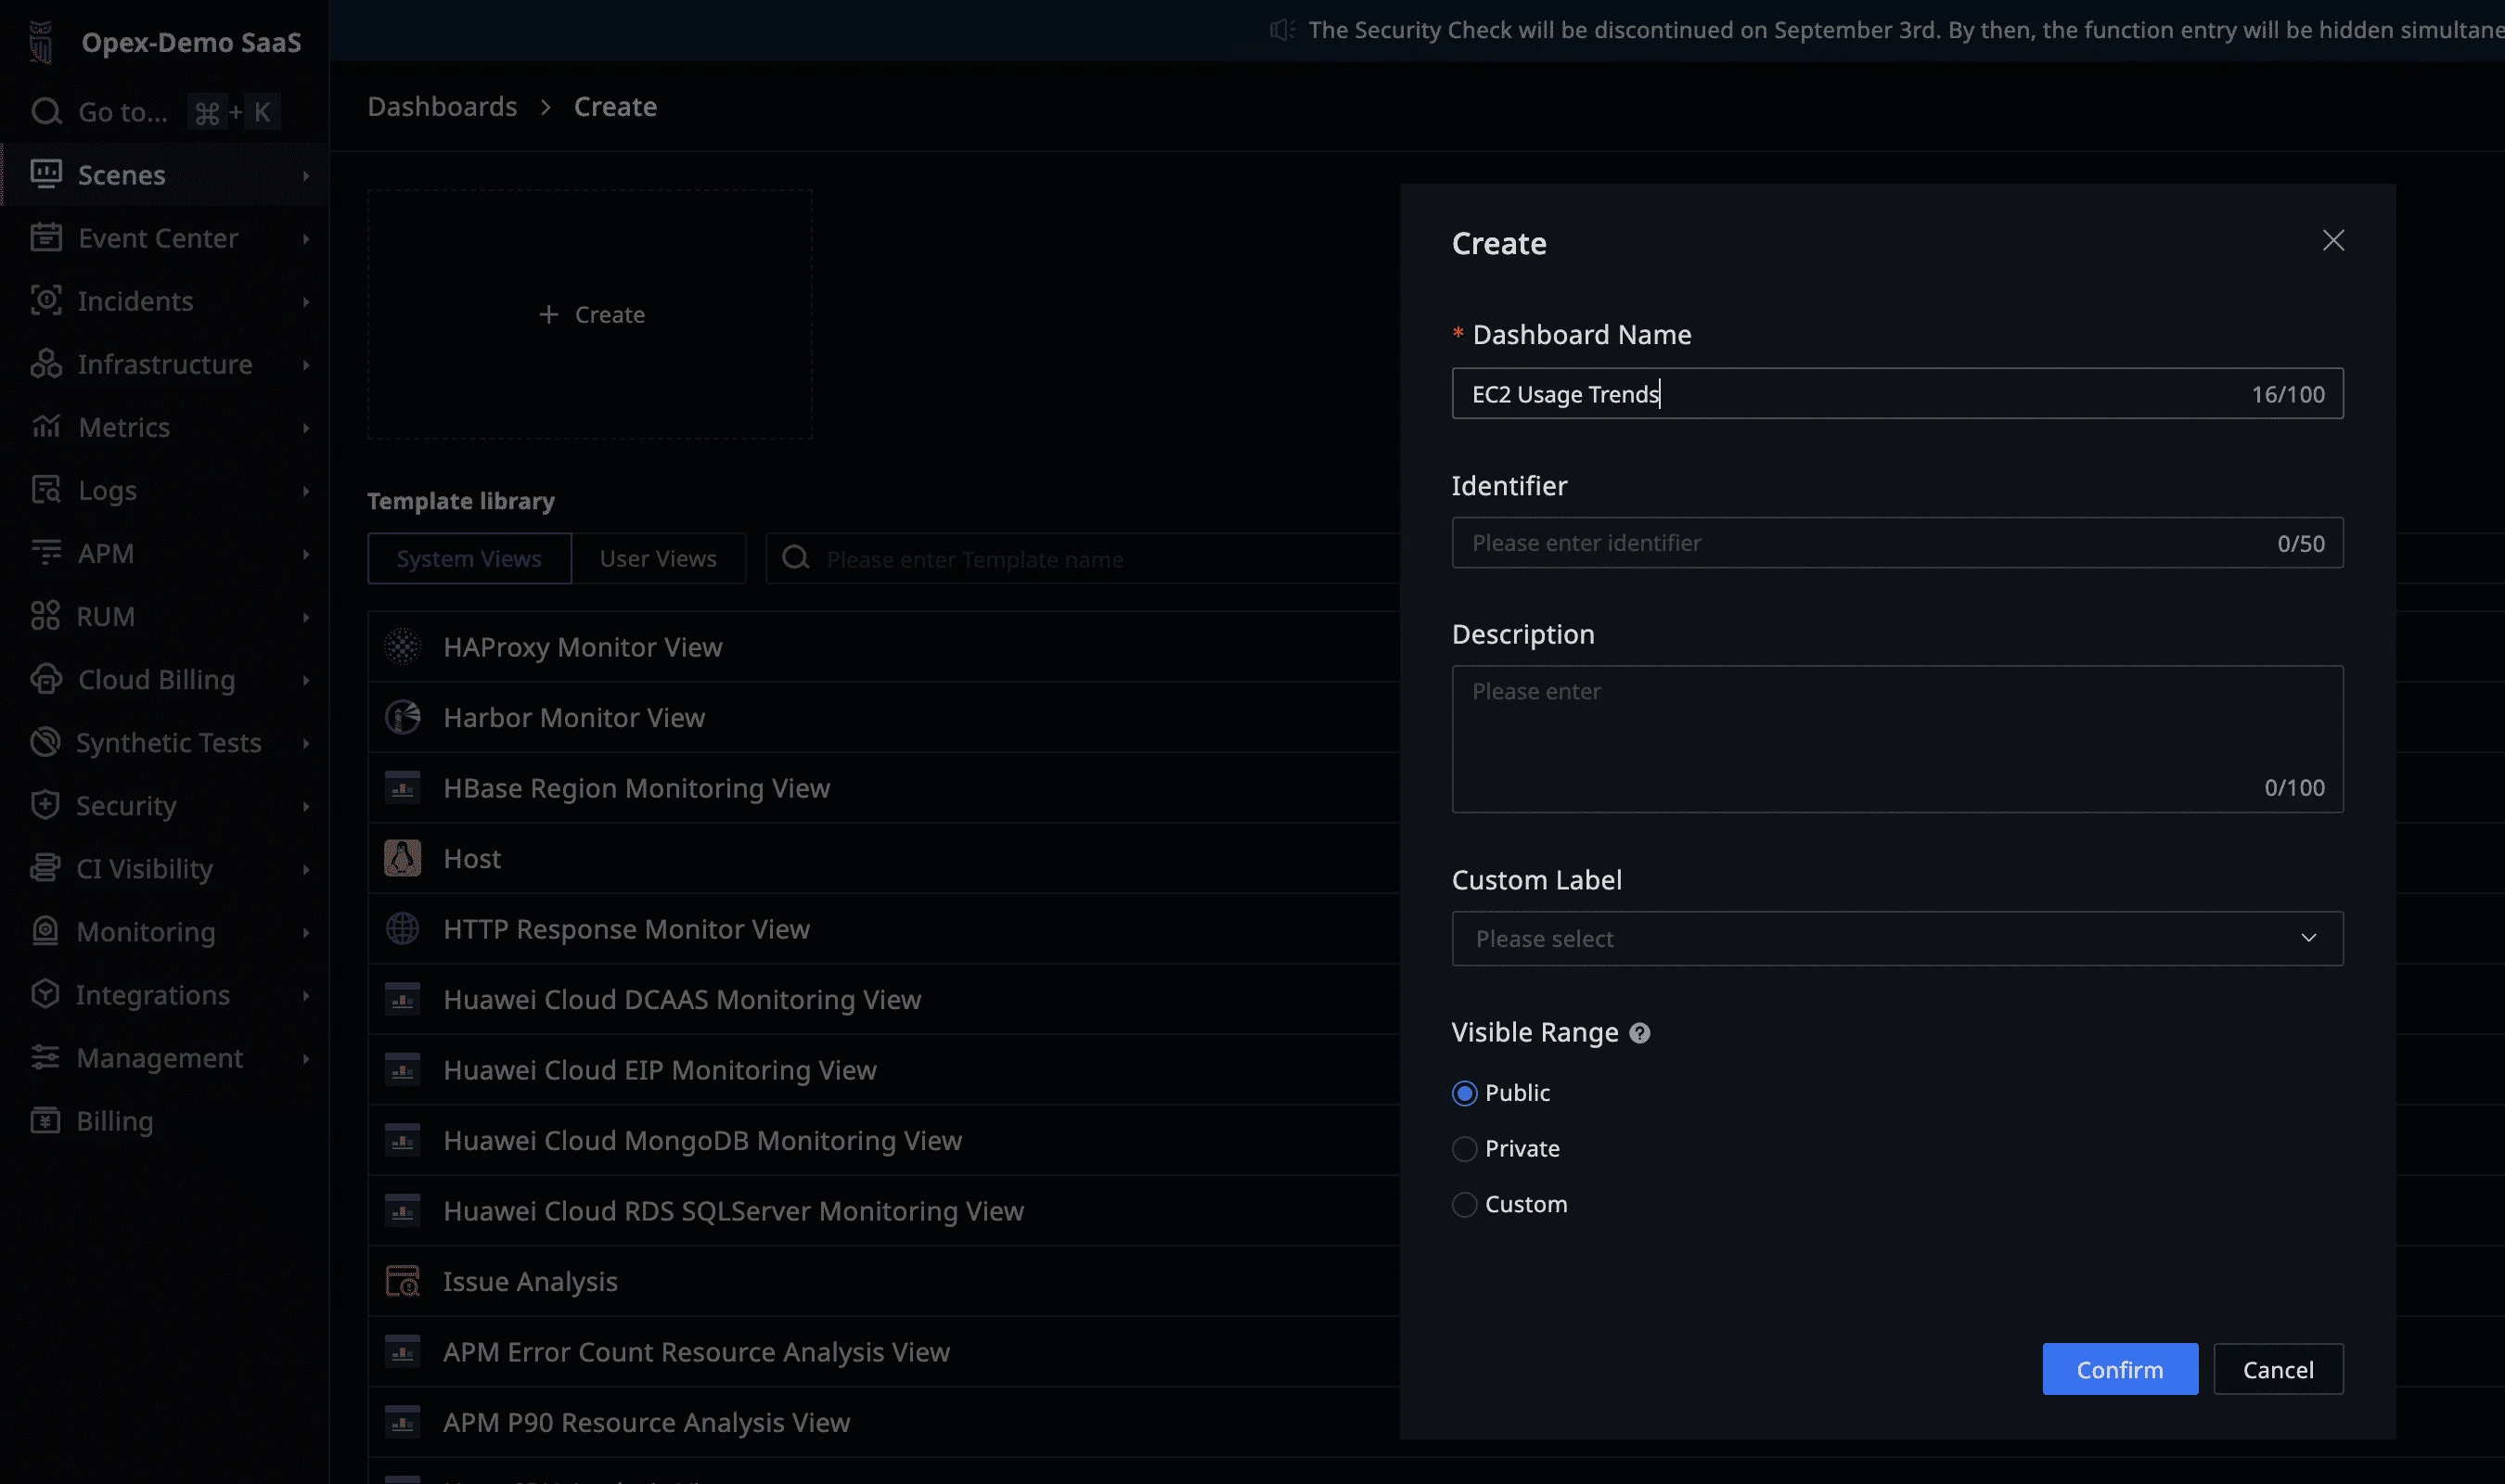
7.3 Create a Drill‑Down Dashboard for EC2 Usage Trends
- Create another dashboard (e.g., EC2 Usage Trends) to visualize EC2 metrics (CPU) as a drill‑down for cost spikes.
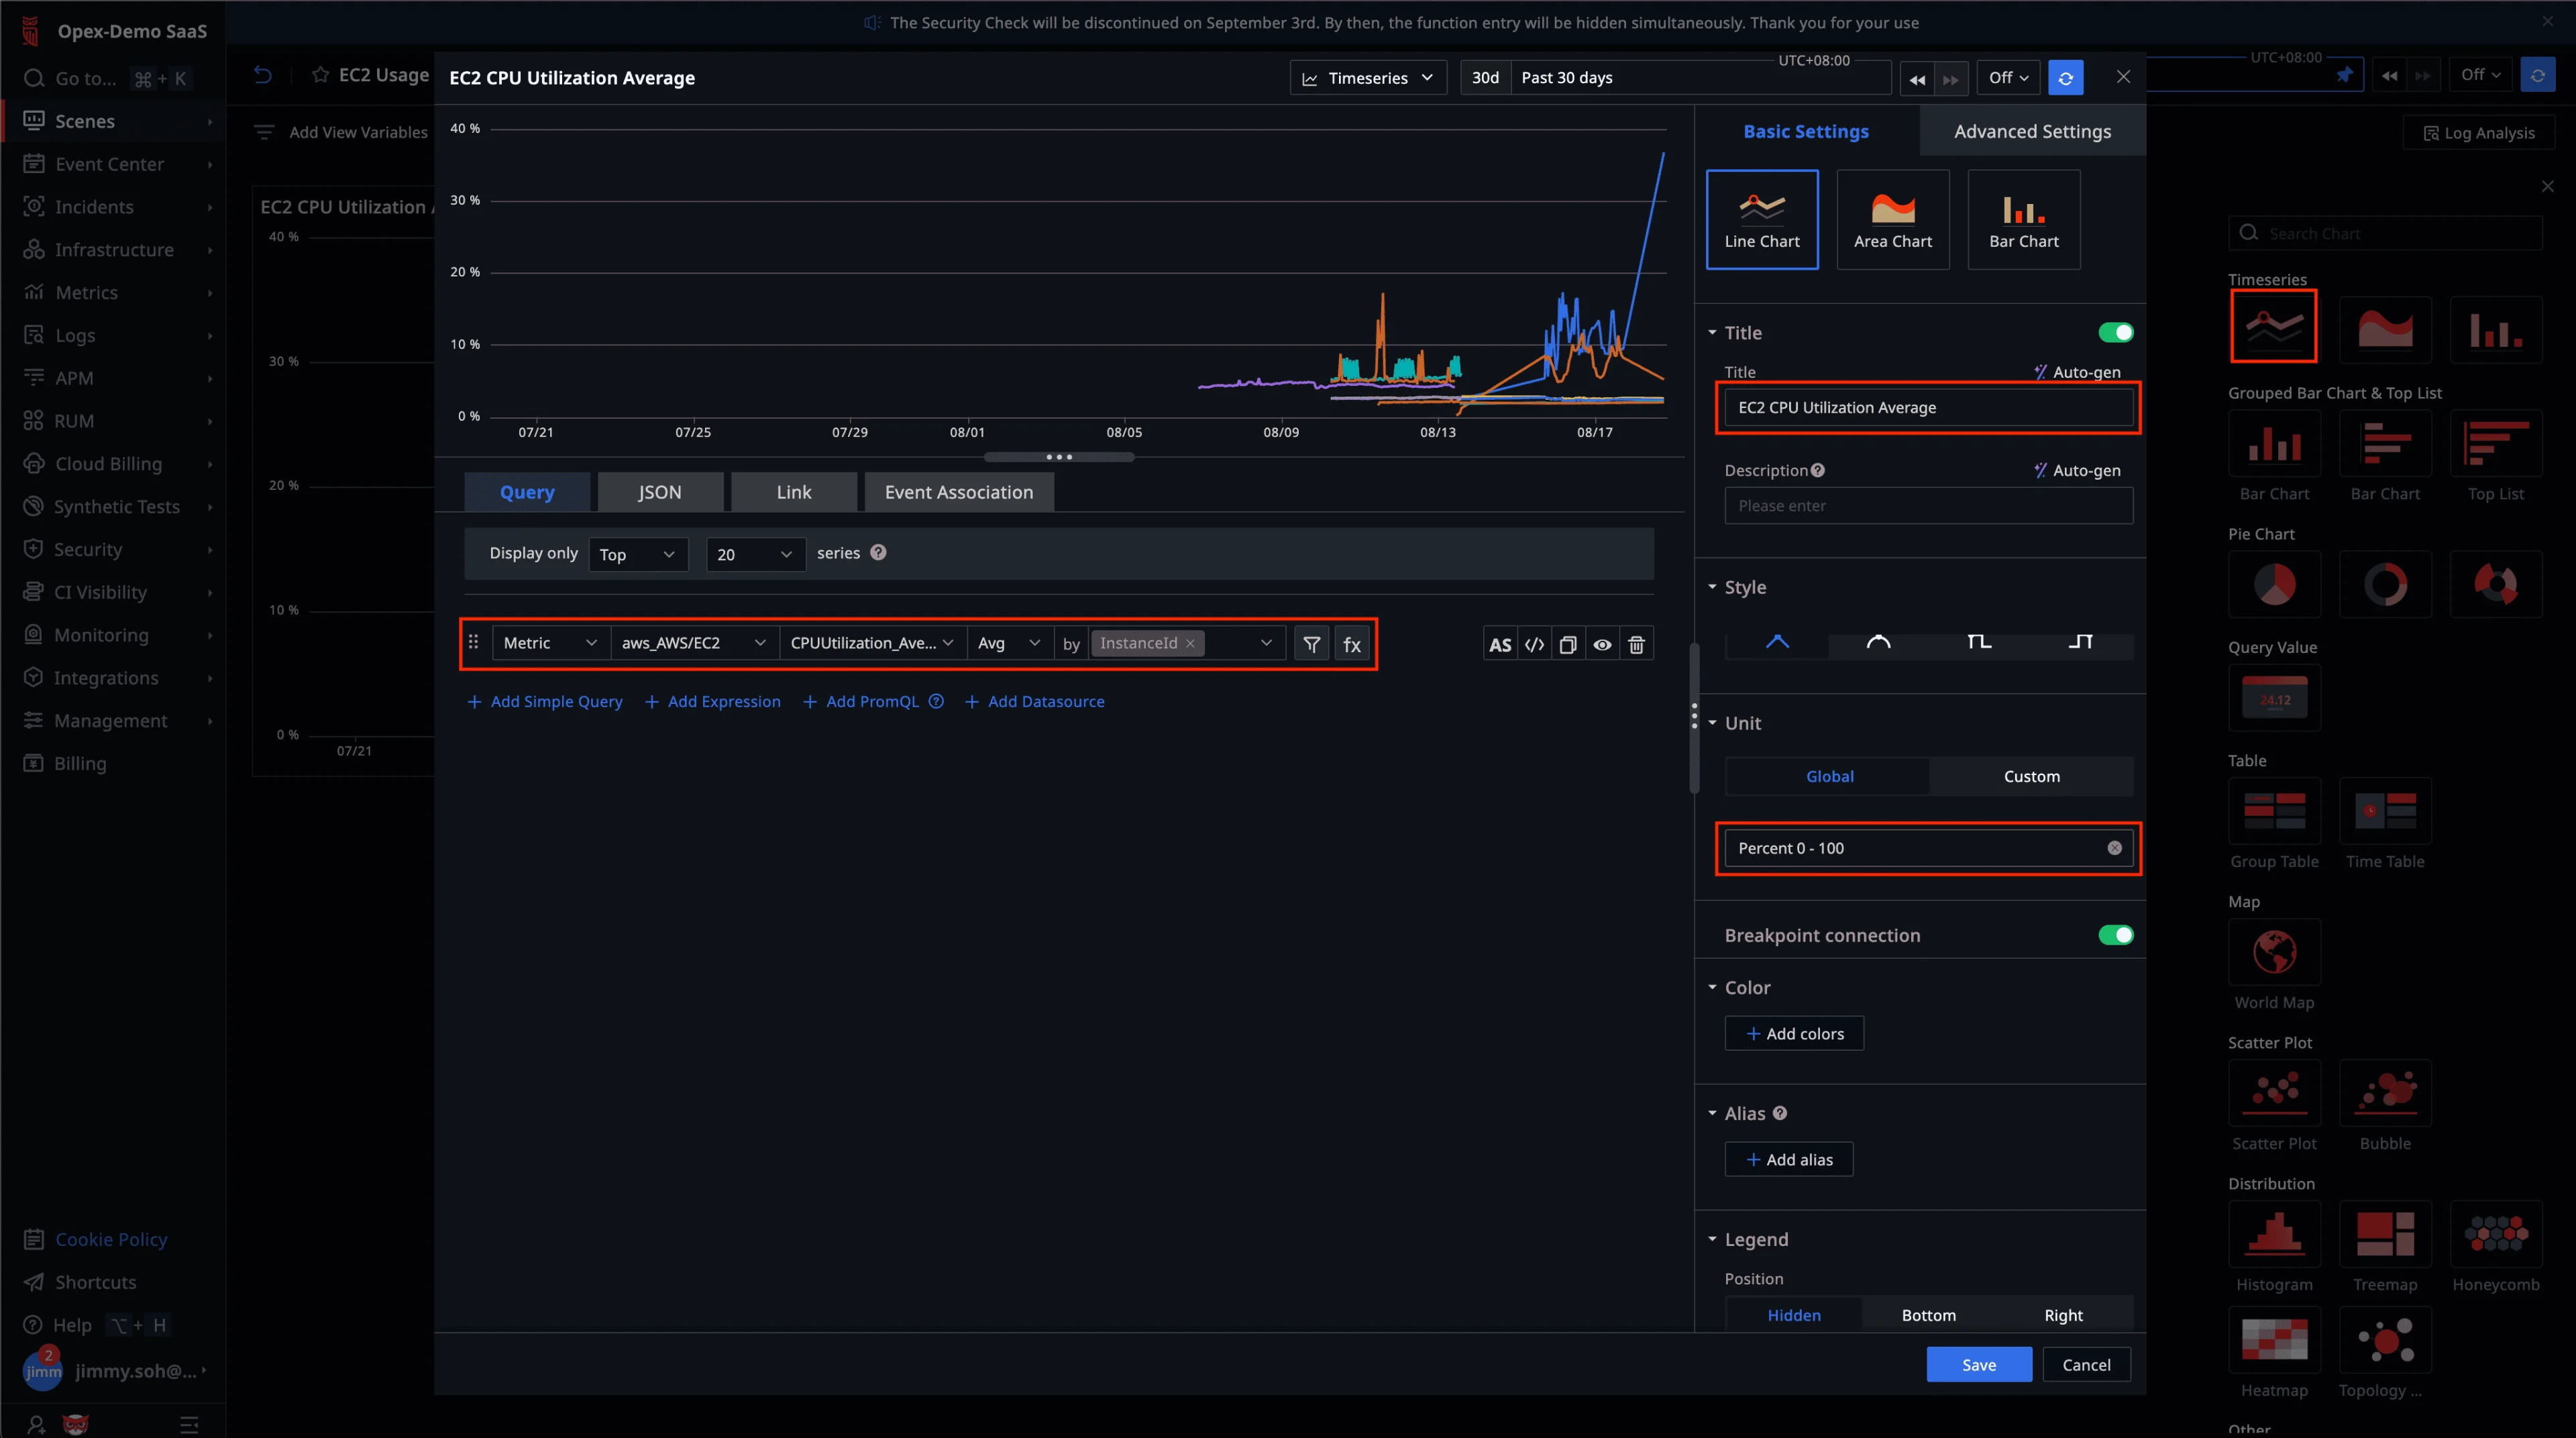
7.4 Add a Timeseries Line Chart
- In EC2 Usage Trends, create a Timeseries line chart using a query like the screenshot. Save the widget.
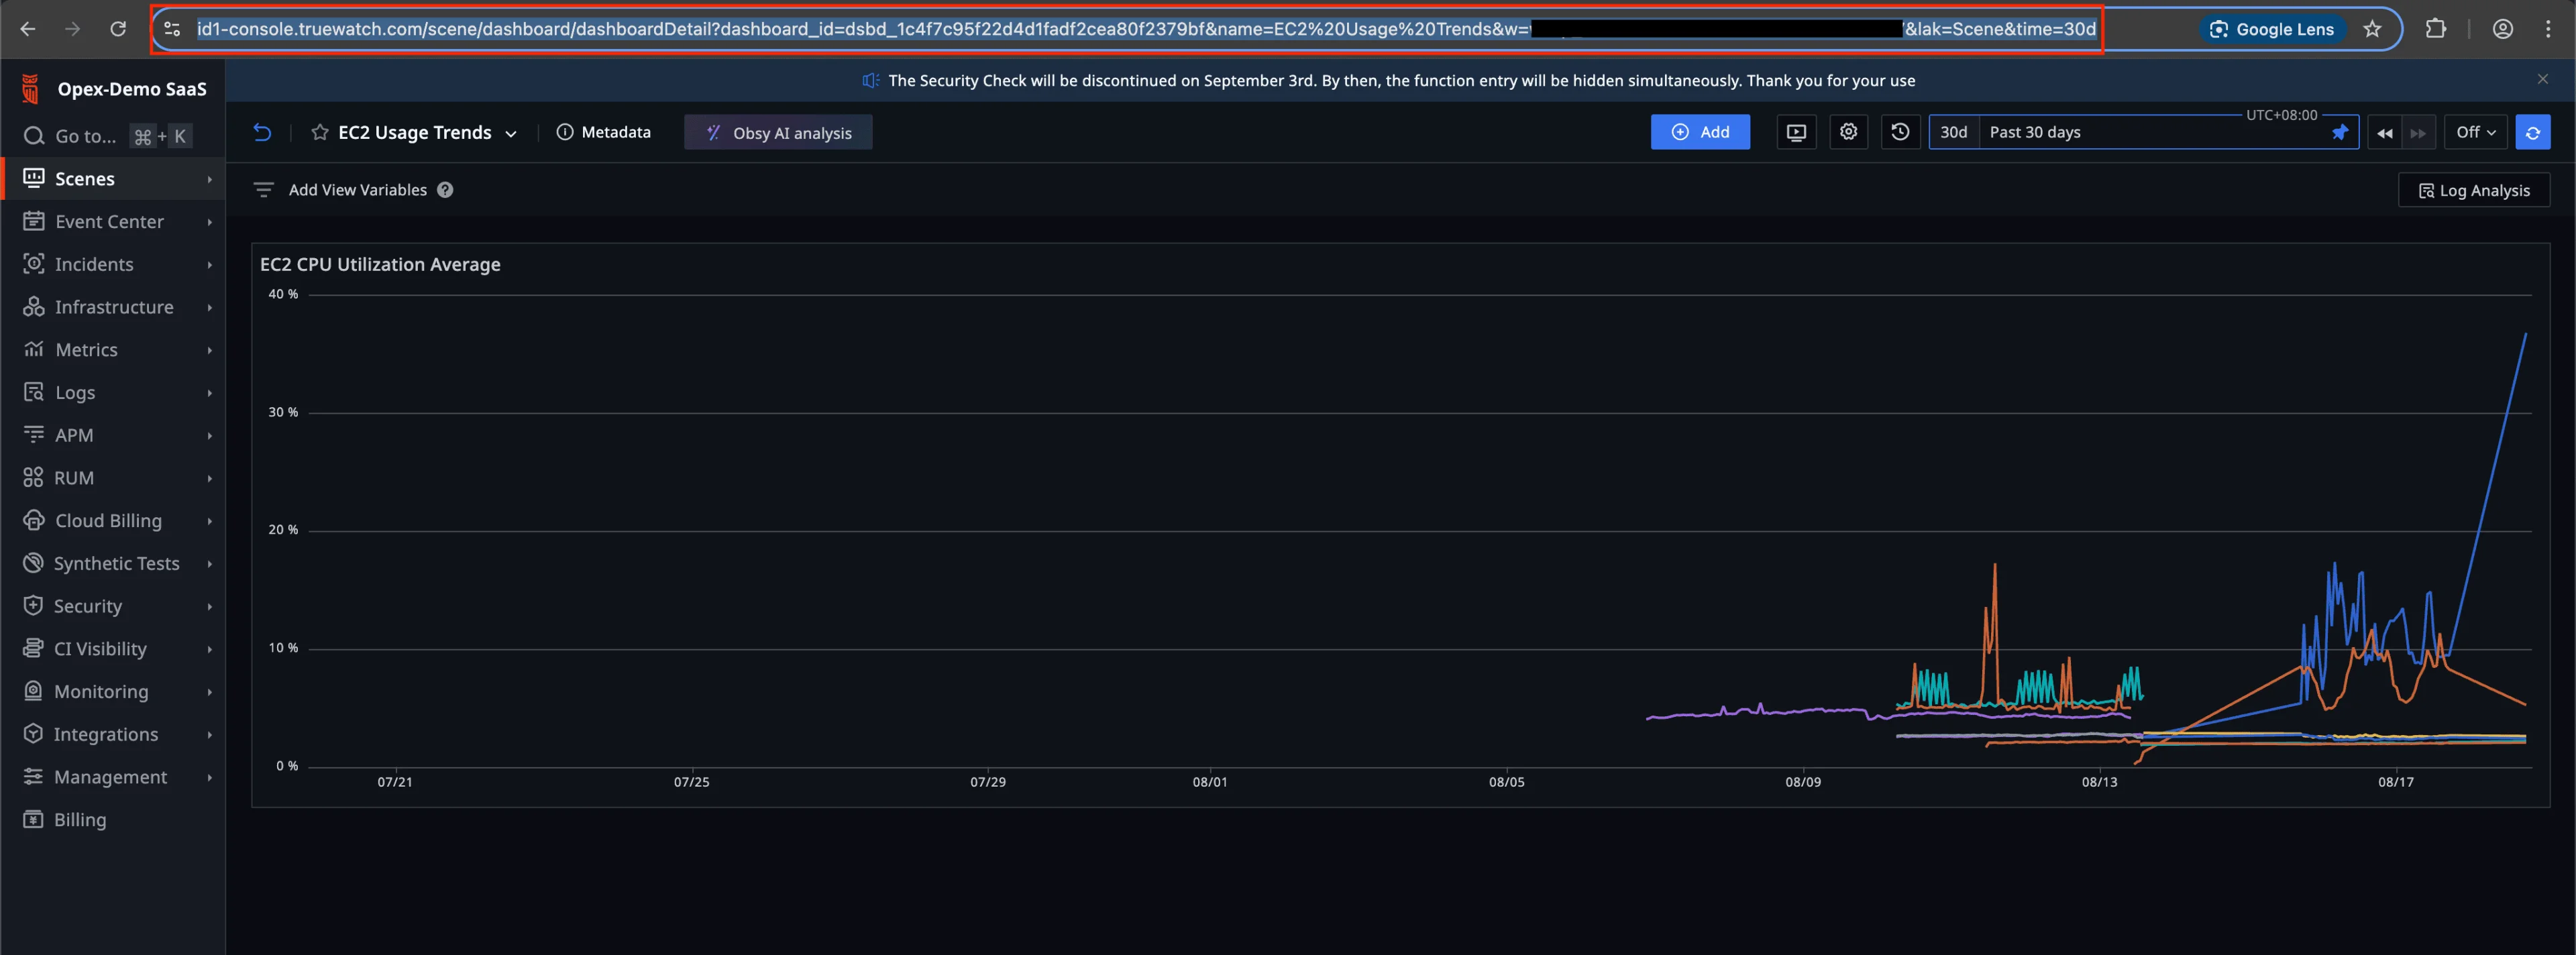
7.5 Size the Widget & Copy Its URL
- Adjust the widget size if needed. Copy the URL from your browser.
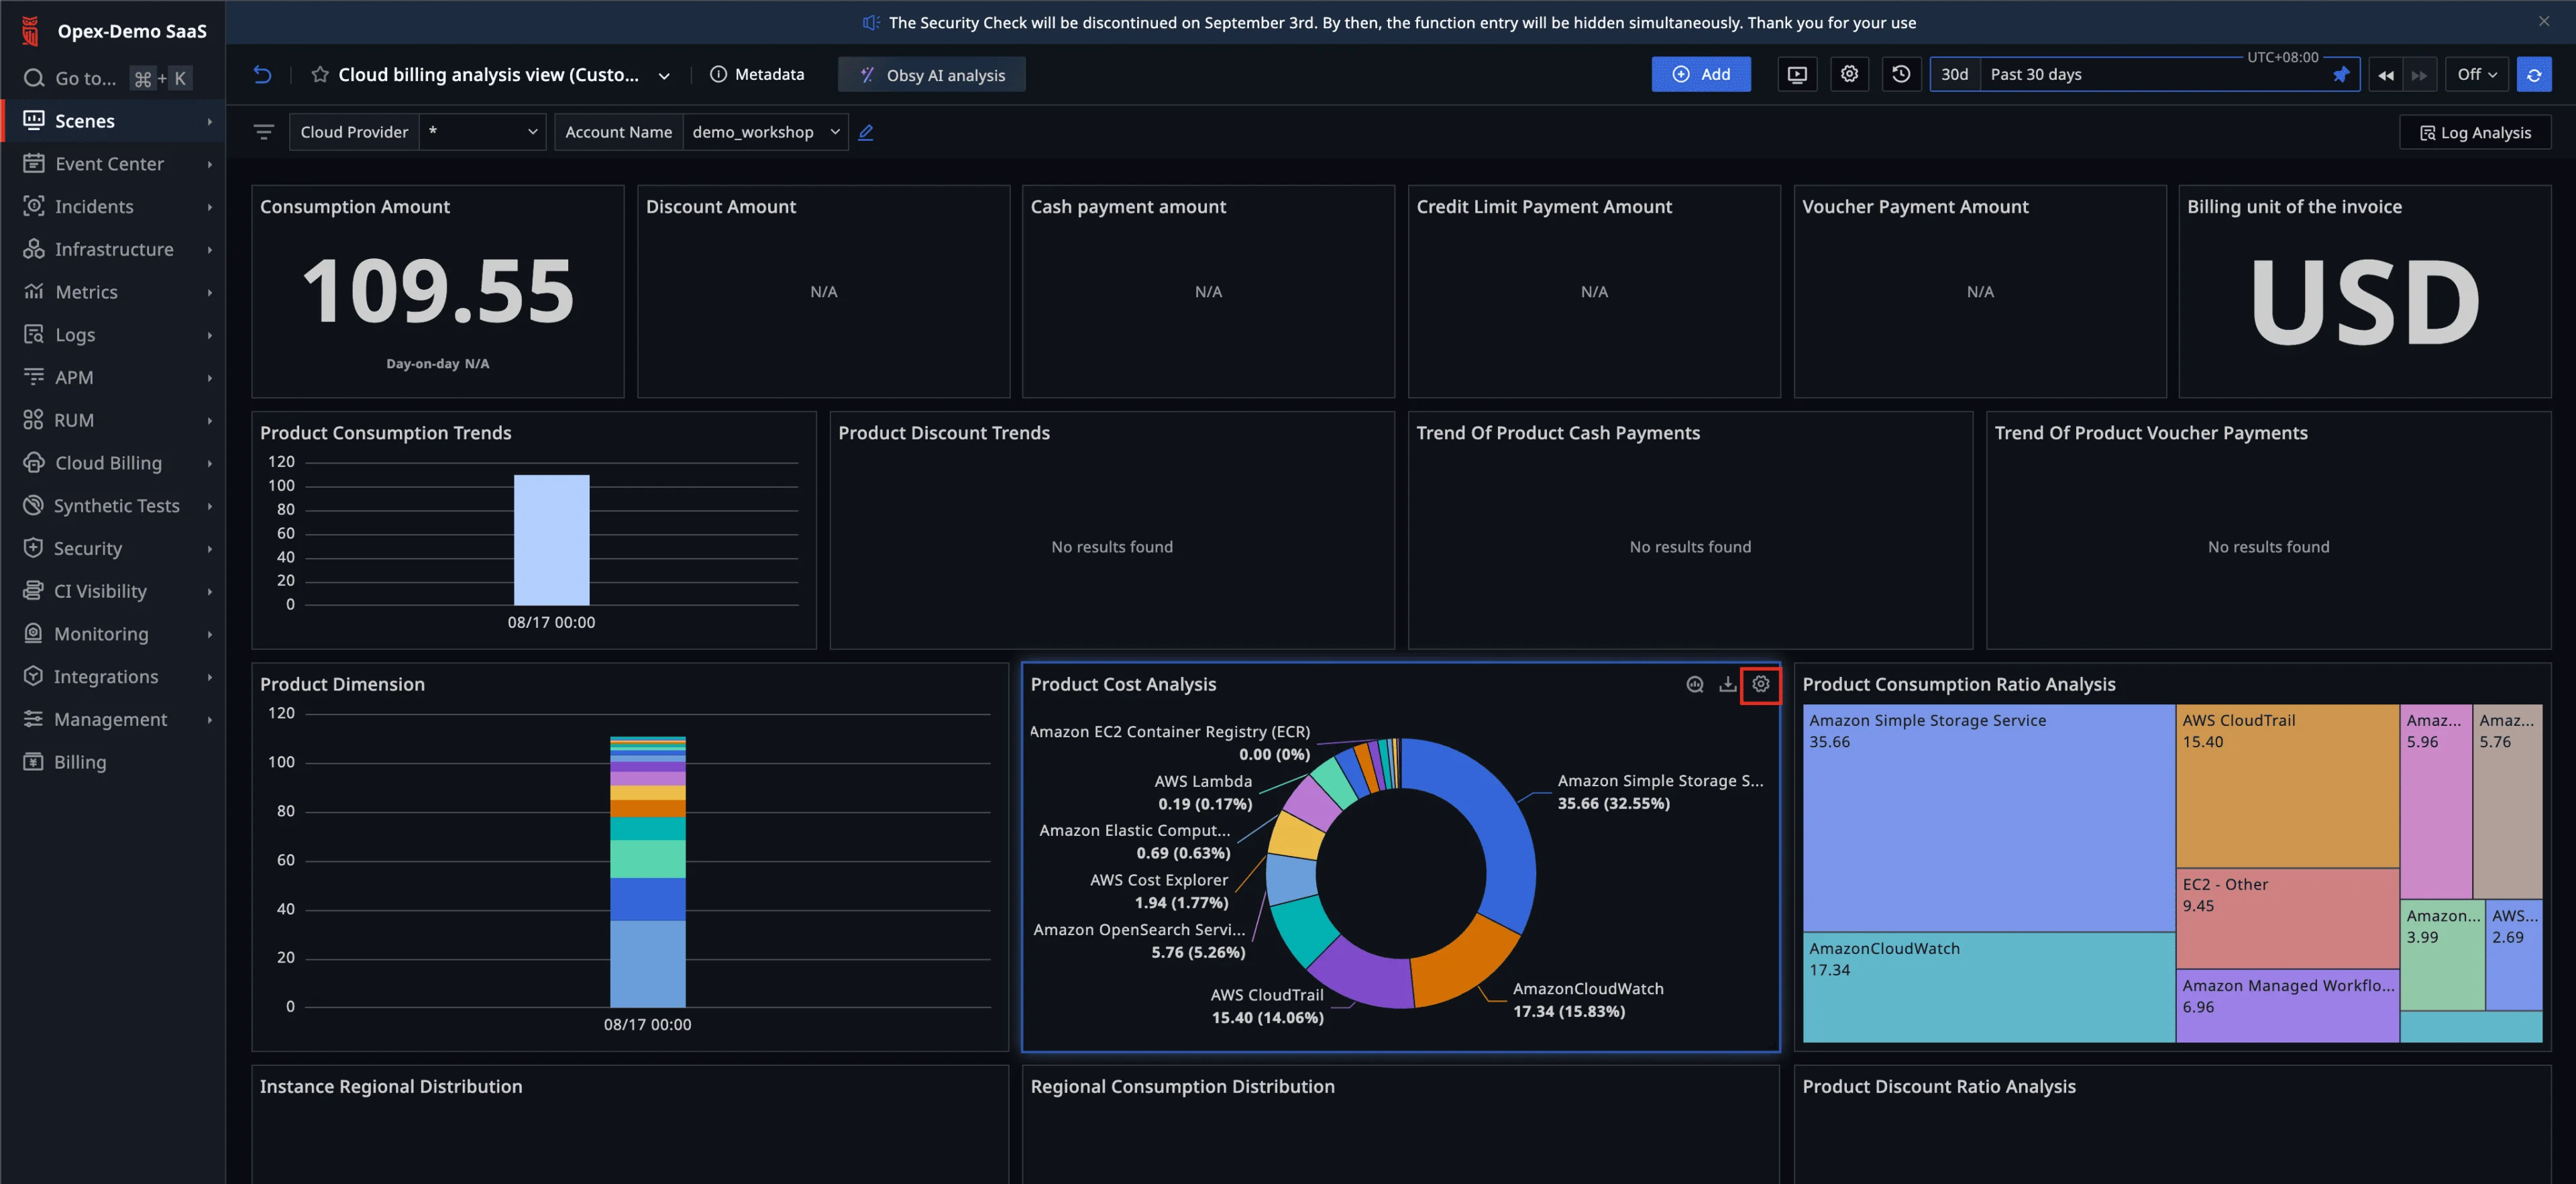
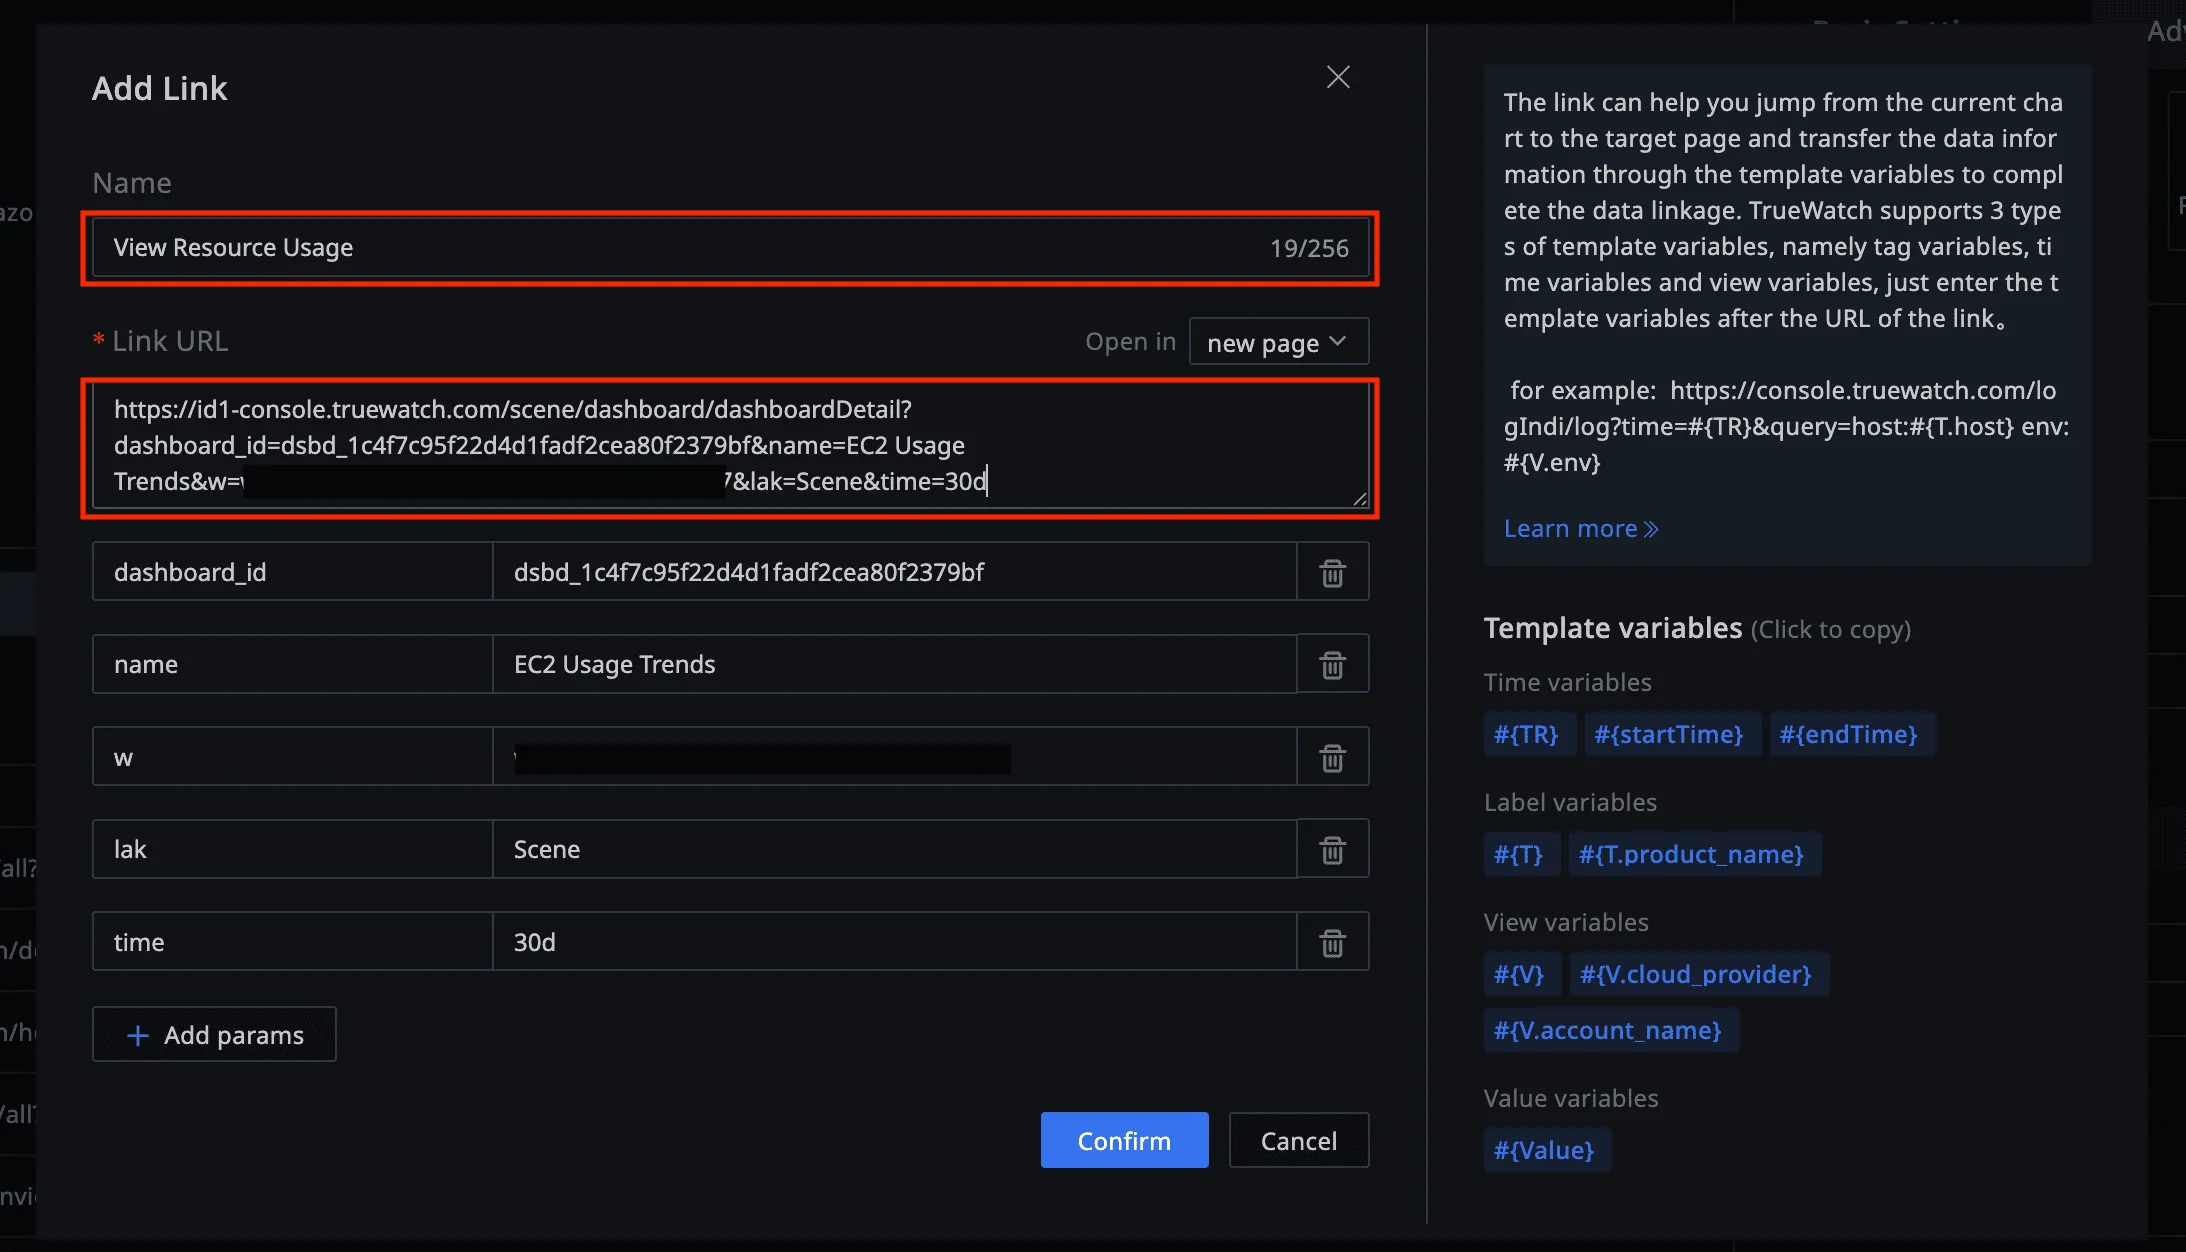
7.6 Link Cost Widget to the Drill‑Down
- Go back to Cloud billing analysis view (Custom). In Product Cost Analysis widget, click the gear icon.
- Open the Link tab, click Add Link.
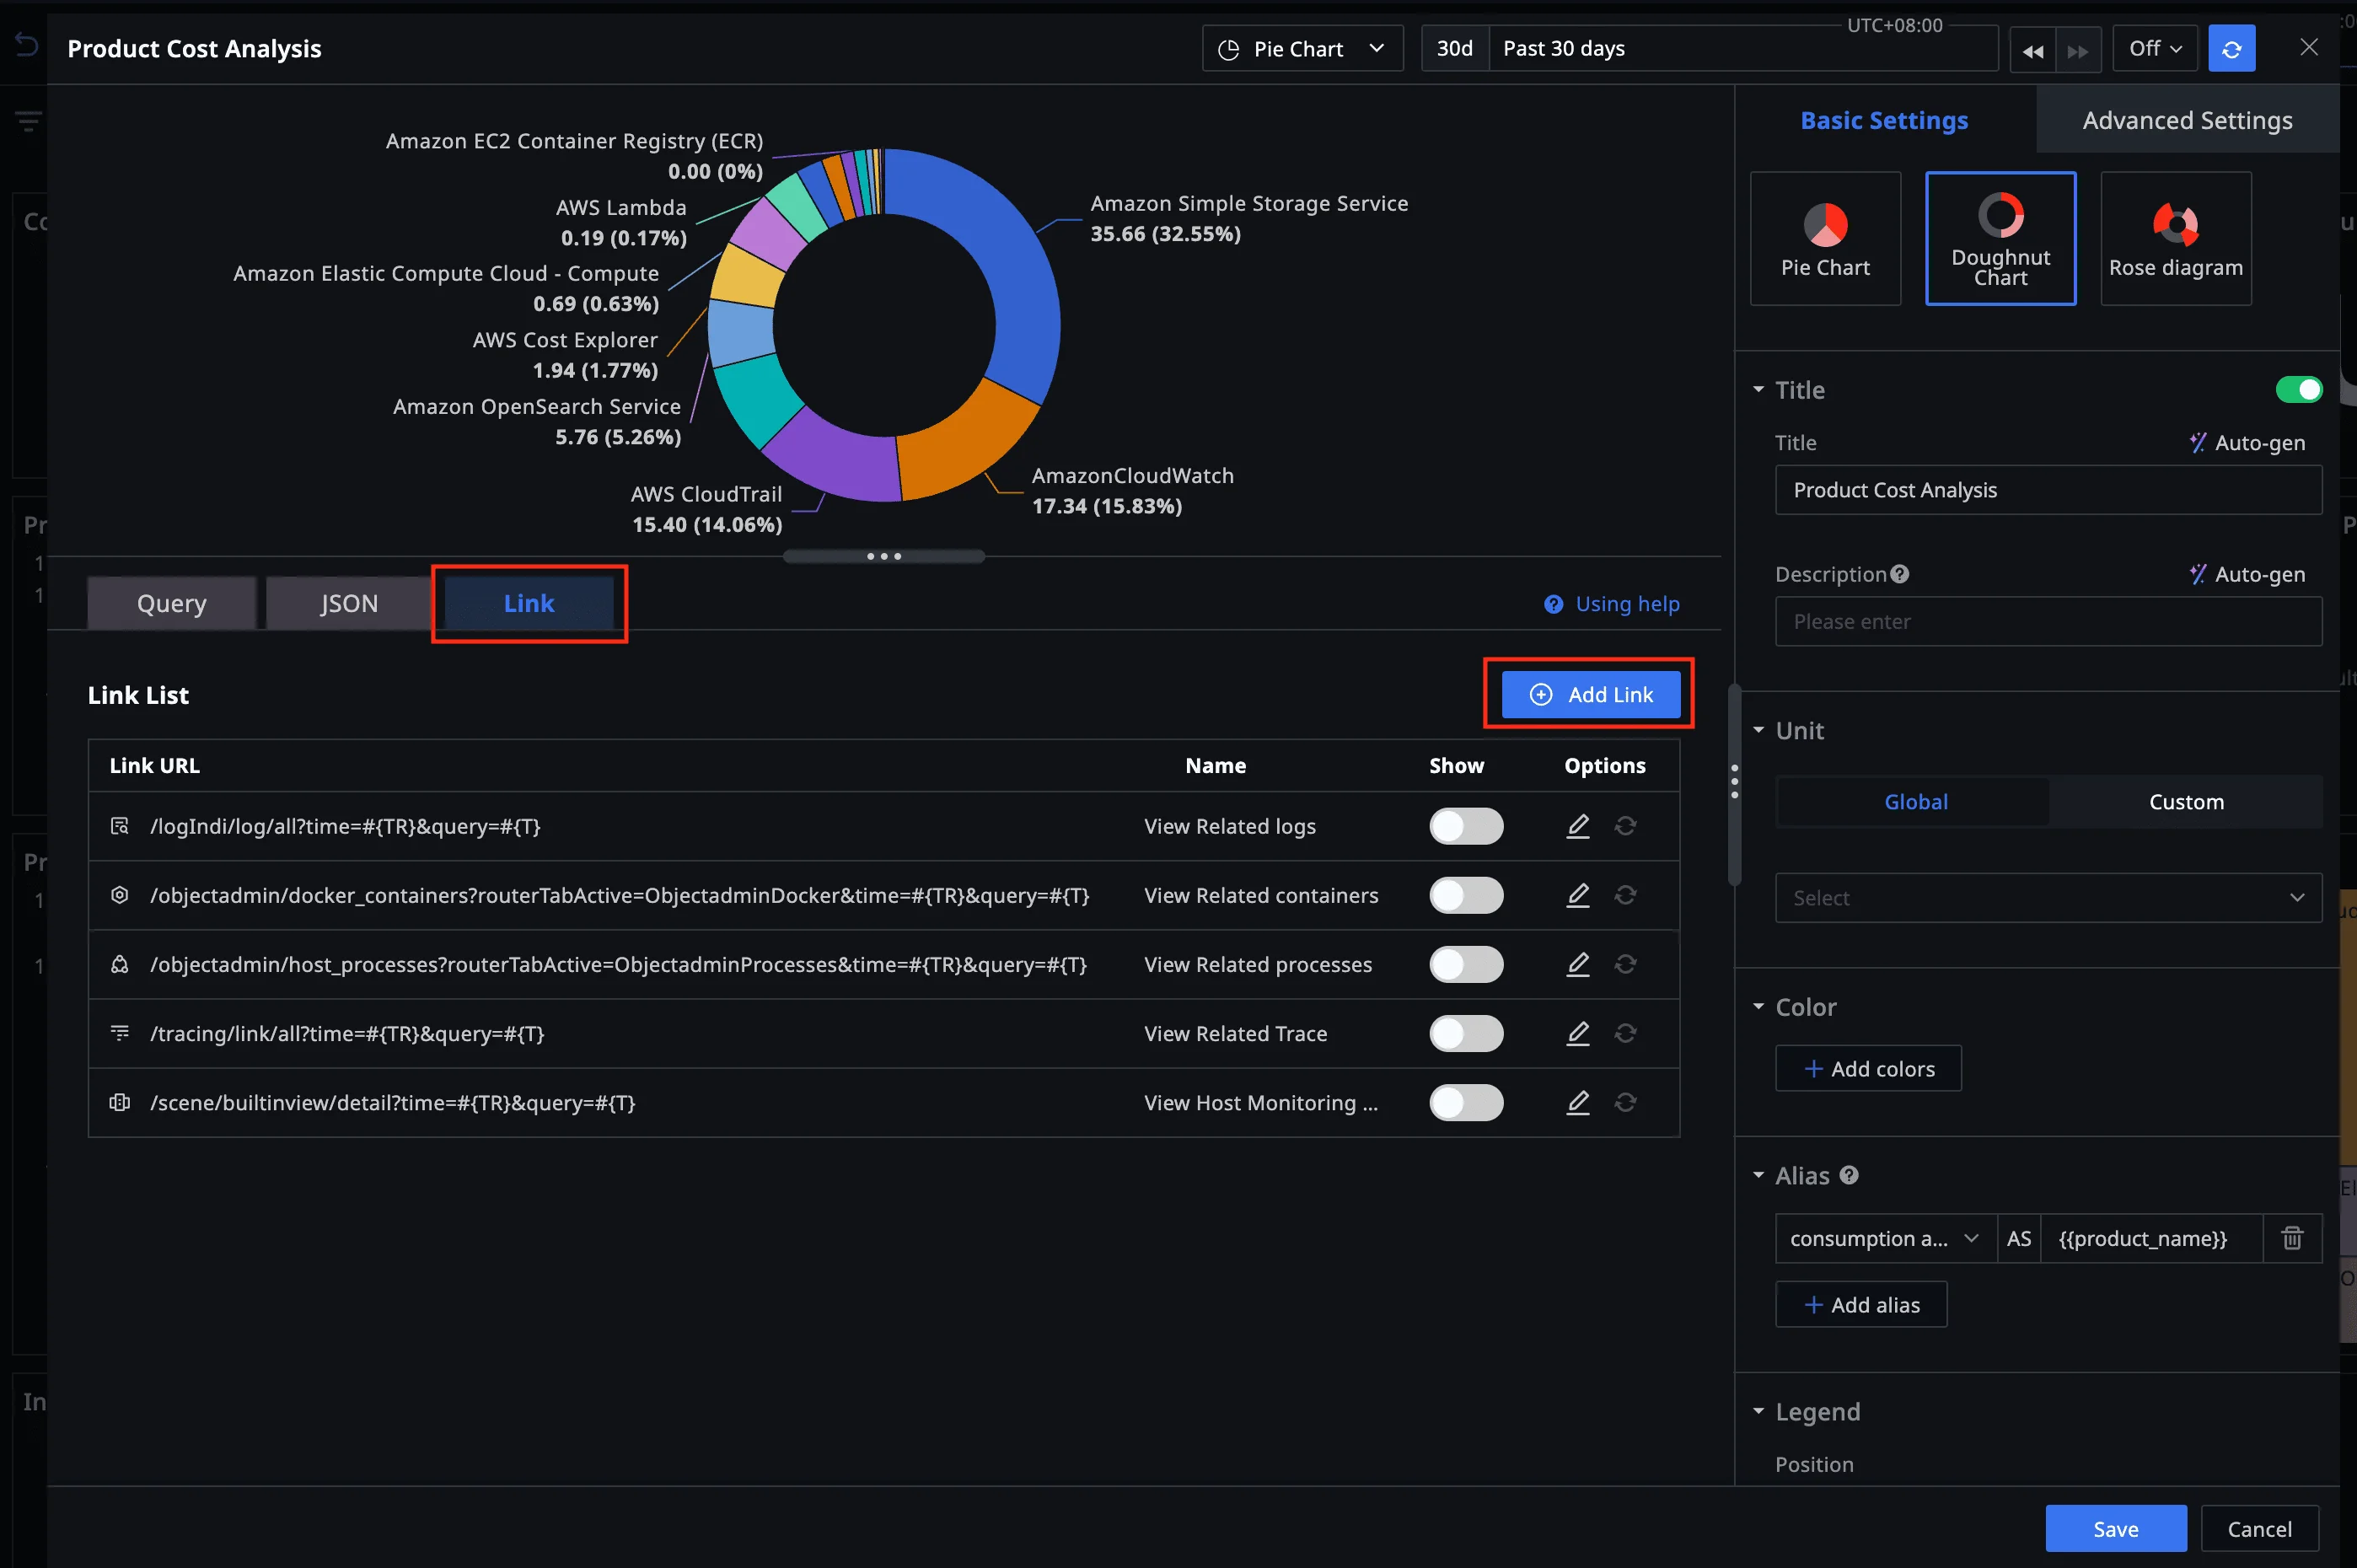
- Give the link a friendly name, paste the EC2 Usage Trends widget (or dashboard) URL, click Confirm, then Save.
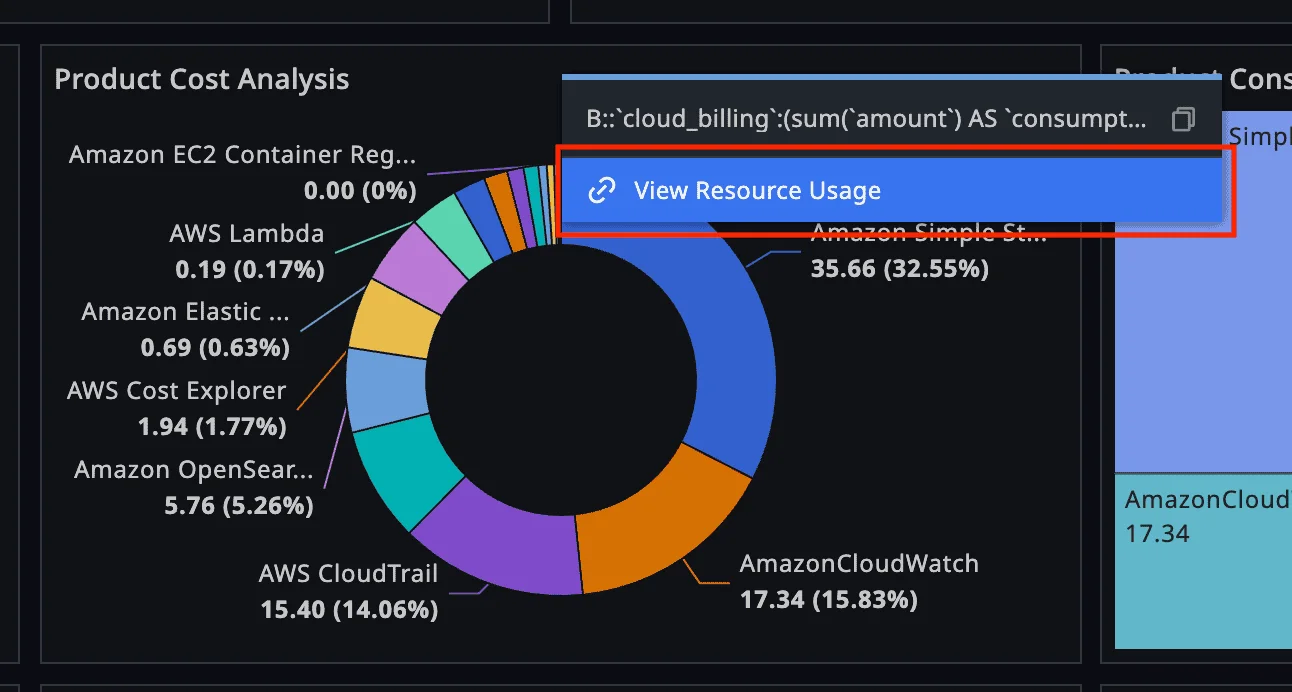
7.7 Validate the Drill‑Down
- In Product Cost Analysis, click on the chart and select your new link to drill down into the EC2 usage view.
You can pass variables (e.g.,
account,service,region) to further contextualize the drill‑down target page.
8. Operations & Runbooks (Recommended)
- Scheduling & Backfill: Keep Cron at 5–15 min for near‑real‑time visibility; add a longer‑range backfill job if needed (hourly) to catch transient API issues.
- Scaling: If you monitor dozens of namespaces (EC2, EBS, ELB, RDS, EKS), consider multiple scripts/Cron jobs per namespace to avoid API throttling.
- Multi‑account strategy: Use separate ENVs and script instances per AWS account to isolate credentials and rate limits.
- Versioning: Clone a script to a
-canaryvariant; validate new metrics or dimensions in Metric Analysis before promoting. - Tags discipline: Adopt a standard tag schema (
account,env,team,service,region) so FinOps charts are consistent.
9. Security & Governance Best Practices
- Least privilege: Start with the policy in Appendix A; expand only if required.
- Secret hygiene: Store the Secret key as Password in ENV (masked). Rotate keys quarterly or on offboarding.
- Audit: Track AWS API calls in CloudTrail for the metrics user; review Automata job history for change control.
- Network egress: If enforcing egress policies, allow outbound to AWS CloudWatch APIs for the chosen region.
10. Troubleshooting
| Symptom | Likely Cause | Where to Check |
|---|---|---|
| No points in Metric Analysis | Cron not running; wrong region; wrong metric names | Automata Cron logs; verify script config; confirm CloudWatch metrics exist |
| AccessDenied errors | IAM policy too strict / wrong principal | AWS CloudTrail, IAM policy simulator |
| Sporadic gaps in charts | CloudWatch API throttling | Reduce Cron frequency; split namespaces across jobs |
| Billing panels empty | Billing job not created or failing; credentials invalid | Automata Cron logs for the billing job; re‑test account in Integrations |
| Dashboard link does nothing | URL copied wrong; permission issue | Re‑copy URL from the target page; ensure user roles can access target dashboard |
© 2025 TrueWatch Demo Workshop
