
Observability tool sprawl happens when an organization builds up separate, loosely connected tools for metrics, logs, traces, real user monitoring (RUM), and cloud consoles, each adopted by a different team for a different reason. No single purchase looks like a problem. Together, they raise infrastructure and license spend, add maintenance work, slow incident response, and make sensitive data harder to govern. For CTOs, the cost is real but rarely visible on one bill.
What Is Tool Sprawl in Observability?
Tool sprawl is the gradual accumulation of overlapping tools that do similar jobs without sharing data or workflows. In observability, it usually shows up as several monitoring, logging, and tracing systems running side by side, each with its own agents, dashboards, and permissions.
It rarely starts as a decision. Visibility arrives one team and one tool at a time.
A business unit adopts a cloud monitoring tool. The platform team adds Kubernetes monitoring. Developers bring in application performance monitoring (APM). Security adds log analysis. Frontend teams add RUM. A new cloud provider comes with its own console, and an acquisition or regional expansion adds a few more systems.
Each choice makes sense locally. Over time, the company is no longer running a monitoring strategy. It is running a collection of partially connected tools.

The Hidden Costs of Observability Tool Sprawl
Infrastructure and License Spend
One monitoring system rarely looks expensive in isolation. Several running in parallel add up.
Many tools need their own storage, compute, agents, and upkeep. Commercial products add license, support, and upgrade fees. Open-source stacks can avoid license spend, but they still require engineering time for storage planning, version upgrades, security patching, and ongoing ownership.
Because these costs sit in different team budgets, nobody sees the full picture. The CTO usually notices the aggregate effect later: duplicated infrastructure, underused systems, and a rising cost base that is hard to attribute. This is why observability cost reduction often starts with an inventory rather than a price negotiation.
Maintenance Overhead
Every monitoring stack comes with its own architecture, query language, agent model, dashboards, alerting logic, permissions, and upgrade path.
An operations team supporting multiple versions of ELK, Prometheus, cloud-native consoles, APM tools, and log platforms has to know each one well. Even when every tool is good at its job, the combined maintenance surface keeps growing.
Lost Productivity and Slower Incident Response
Operations teams have traditionally focused on hardware health, network status, service availability, and alert thresholds. As applications grow more complex, developers also need application context: traces, code paths, errors, logs, release events, and user impact.
When those views live in separate tools, a single investigation can look like this:
- Check a cloud console for infrastructure metrics.
- Open a log platform for application logs.
- Switch to an APM tool for traces.
- Ask another team for dashboard access.
- Line up timestamps and service names by hand.
- Sign in to a production system to find data nobody collected.
This context switching costs productivity and adds risk. The evidence may exist, but if it sits in the wrong tool, the team can miss it while the incident is still open.
Security and Governance Risk
Monitoring data often includes user identifiers, request parameters, internal hostnames, tokens, IP addresses, stack traces, business data, and screenshots of production behavior.
When that data is scattered across tools, governance gets harder:
- Permissions are managed in several places.
- Data masking rules differ from system to system.
- Audit trails are incomplete or inconsistent.
- Engineers export logs and screenshots without a clear policy.
- Sensitive data ends up in systems that were never designed to hold it.
This is an operational risk as much as a compliance one. Teams cannot protect data well if they do not know where it is collected, stored, queried, and shared.
How Unified Observability Reduces Tool Sprawl
Unified observability means collecting and correlating metrics, logs, traces, user sessions, and events in one platform, on a shared data model, so every team works from the same view of production.
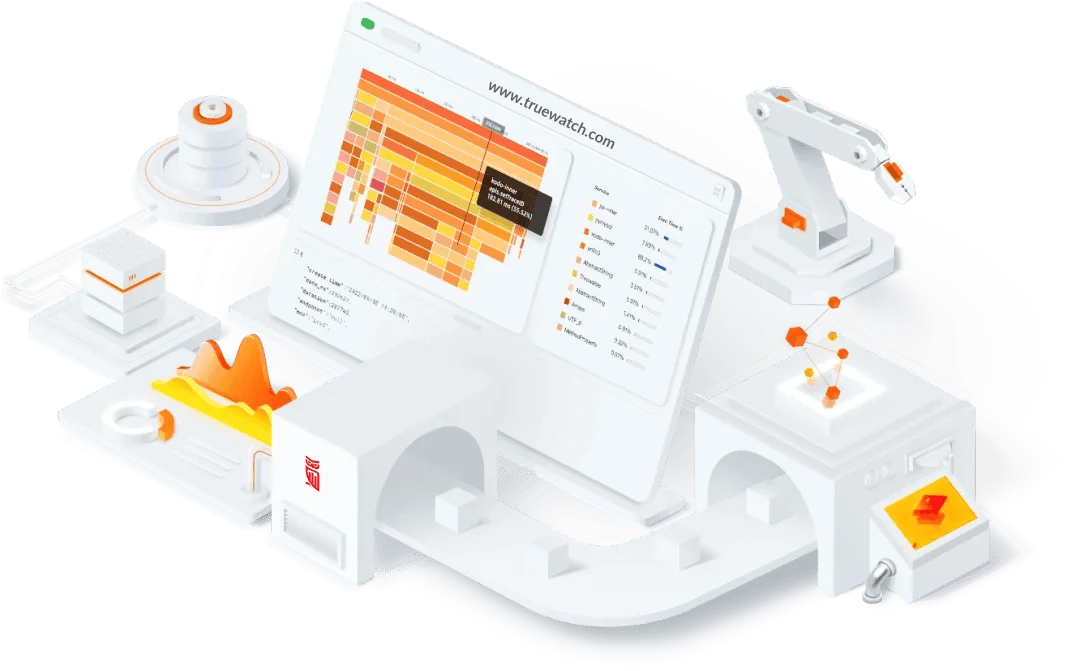
TrueWatch brings infrastructure monitoring, logs, traces, RUM, dashboards, alerts, cloud resources, and business context into one observability platform. The point is not to add one more tool. The point is a shared operating model.
One Data View for Incident Response
When telemetry is correlated in one place, engineers can follow an incident with less switching between tools.
Take a slow checkout flow. An engineer can move from frontend RUM data to API traces, service errors, Kubernetes events, database metrics, logs, and service ownership, without rebuilding the timeline by hand.
Lower Long-term Maintenance
A unified observability platform reduces the number of independent stacks, agent models, dashboards, and permission schemes a team has to maintain.
Existing systems do not need to disappear overnight. In most enterprises, monitoring consolidation happens in stages. What changes is the direction: new observability work is built on a common data model and shared workflows instead of another isolated tool.
Clearer Governance for Sensitive Data
Centralizing observability also makes governance more practical. Access control, data masking, audit trails, retention policies, and data forwarding can be managed within one clear boundary.
Observability data is production data. It deserves the same discipline as application data: clear ownership, deliberate permission design, defined retention, and auditability.
How to Reduce Observability Tool Sprawl
Start by sizing the problem. These questions give CTOs and platform leads a working baseline:
- Inventory the stack. How many monitoring, logging, tracing, and RUM systems are in use today?
- Map ownership. Which teams own each tool, and who maintains it?
- Find duplicate collection. Where is the same telemetry being collected more than once?
- Trace incident paths. Which incidents require engineers to move across three or more tools?
- Check data exposure. Which systems hold sensitive data, and how are their permissions audited?
- Total the cost. What is the full cost of storage, licenses, maintenance, and context switching during incidents?
From there, pick a target platform for new work, migrate the highest-friction workflows first, and retire overlapping tools as teams move across.
The goal is not centralization for its own sake. It is less duplicated work, shorter investigation paths, and a shared view of production for every team.
FAQ
What is tool sprawl?
Tool sprawl is the build-up of overlapping software tools across an organization, usually because teams adopt tools independently. In observability, it means several separate systems for metrics, logs, traces, and user monitoring that do not share data or workflows.
How does tool sprawl impact team productivity?
Engineers lose time switching between consoles, requesting access, and lining up timestamps and service names by hand. During an incident, that slows diagnosis and raises the chance of missing evidence that sits in another tool.
How do you reduce observability costs caused by tool sprawl?
Start with an inventory of every monitoring tool, its owner, and its full cost, including storage and maintenance time. Then remove duplicate data collection and consolidate new work onto one platform, retiring overlapping tools in stages.
Does monitoring consolidation mean replacing every tool at once?
No. Most enterprises consolidate in stages. A practical approach is to build new observability work on a unified platform and retire overlapping tools as teams migrate.
