TrueWatch released a new product update on August 12, 2026, with improvements across Toby AI, Agent Teams, logs, Agent Monitoring, workspace management, Data Forwarding, Unified Catalog, Infrastructure, Monitors, Incident Center, Scenes, Availability Monitoring, Open API, and DataKit.
Toby AI TruePilot
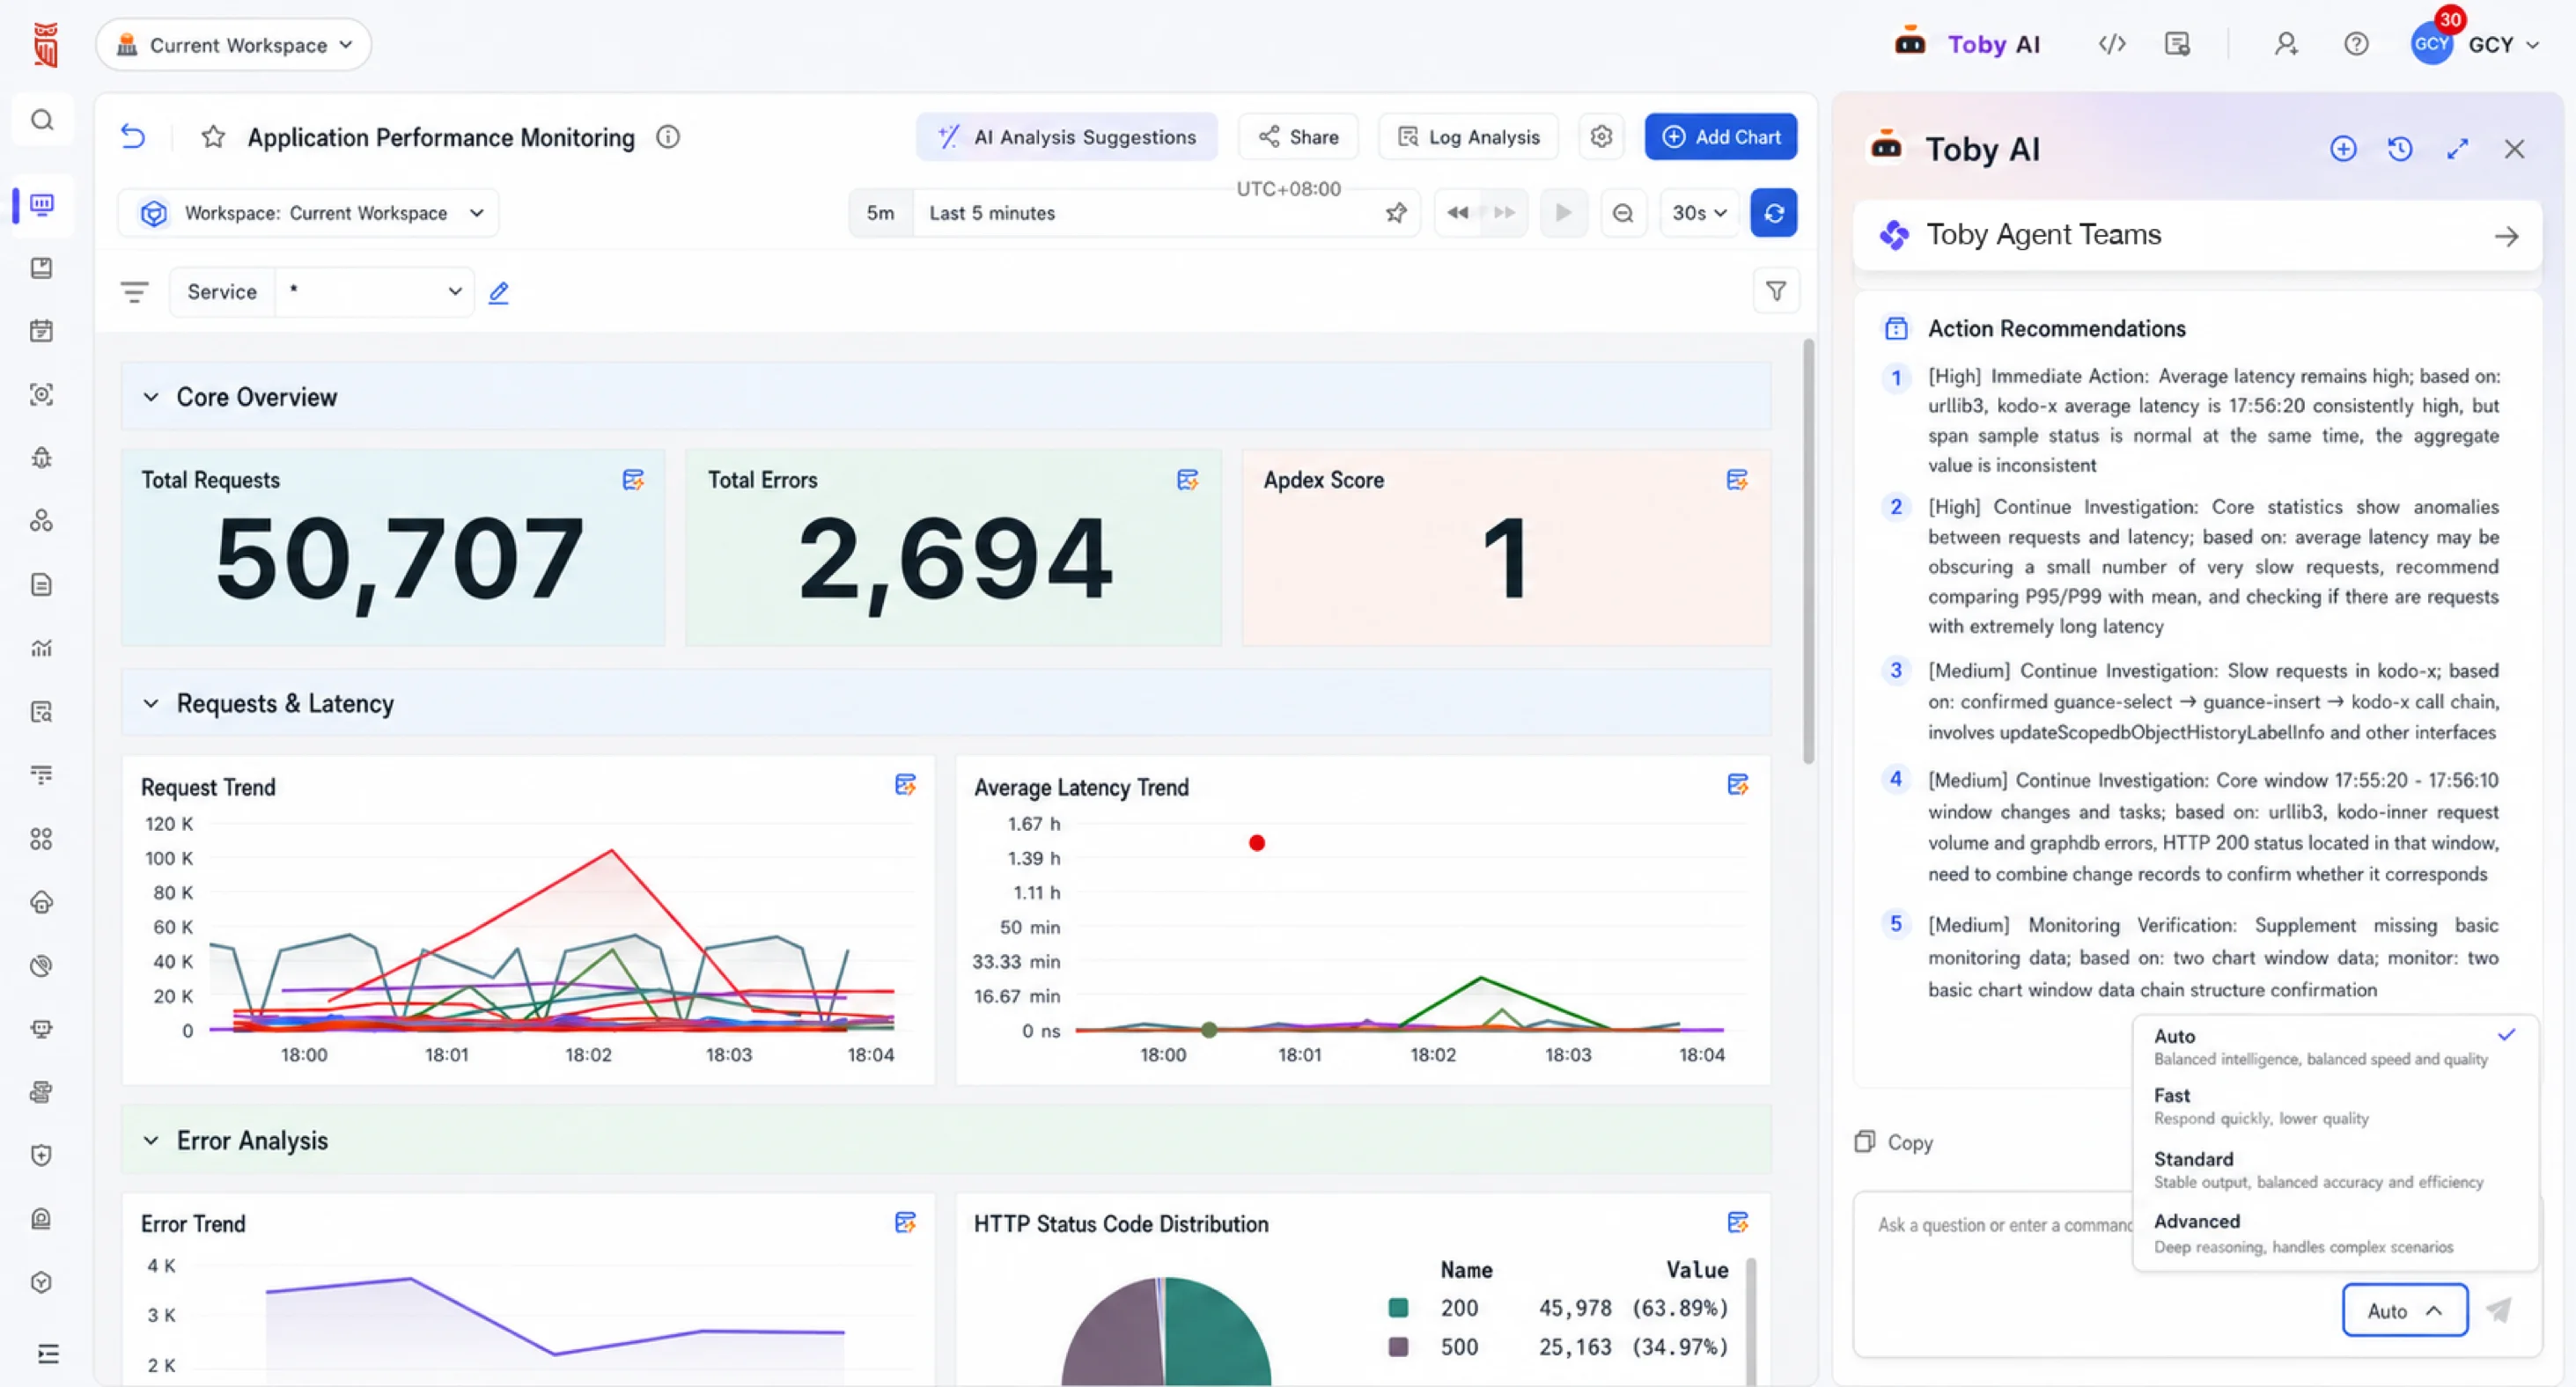
Model tier selection for Toby AI TruePilot
Toby AI TruePilot now supports selecting a model tier, so each task can be matched to a suitable model. Teams get a better balance between analysis quality, response speed, and credit consumption.
Toby AI Agents
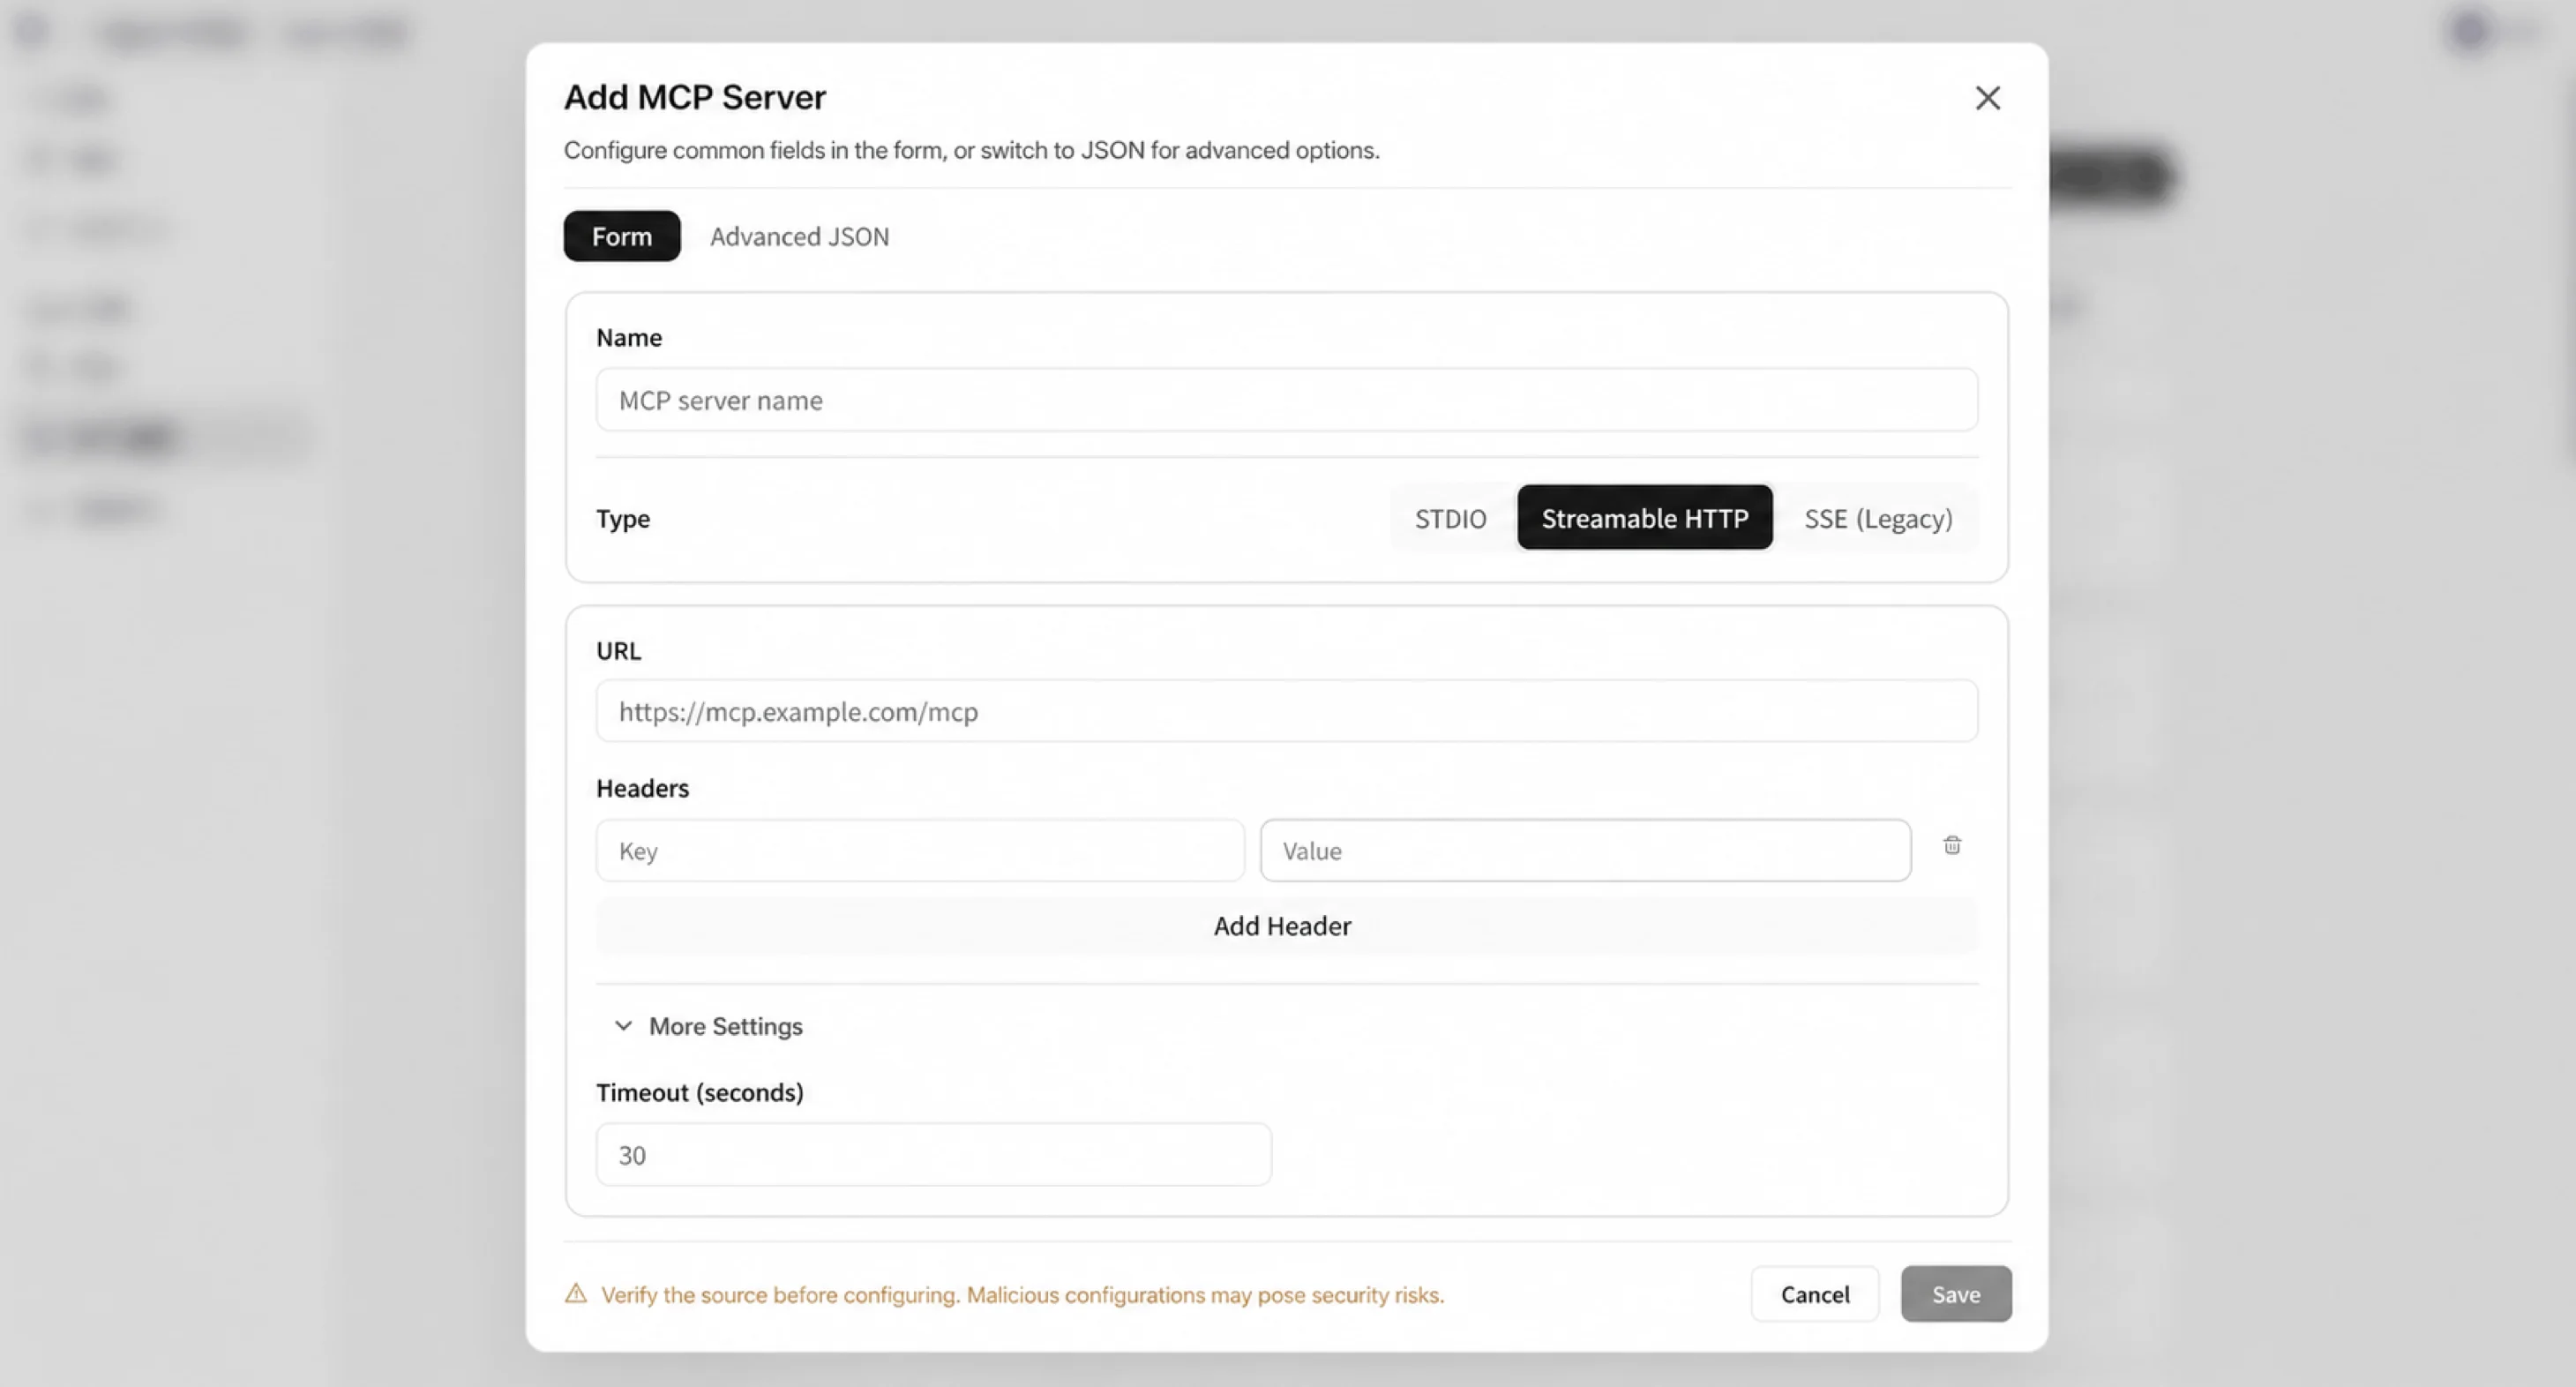
Upgraded MCP configuration experience
MCP can now be configured through either a form or JSON, and the tool list supports loading, viewing, and refreshing. This makes the MCP configuration state much clearer.
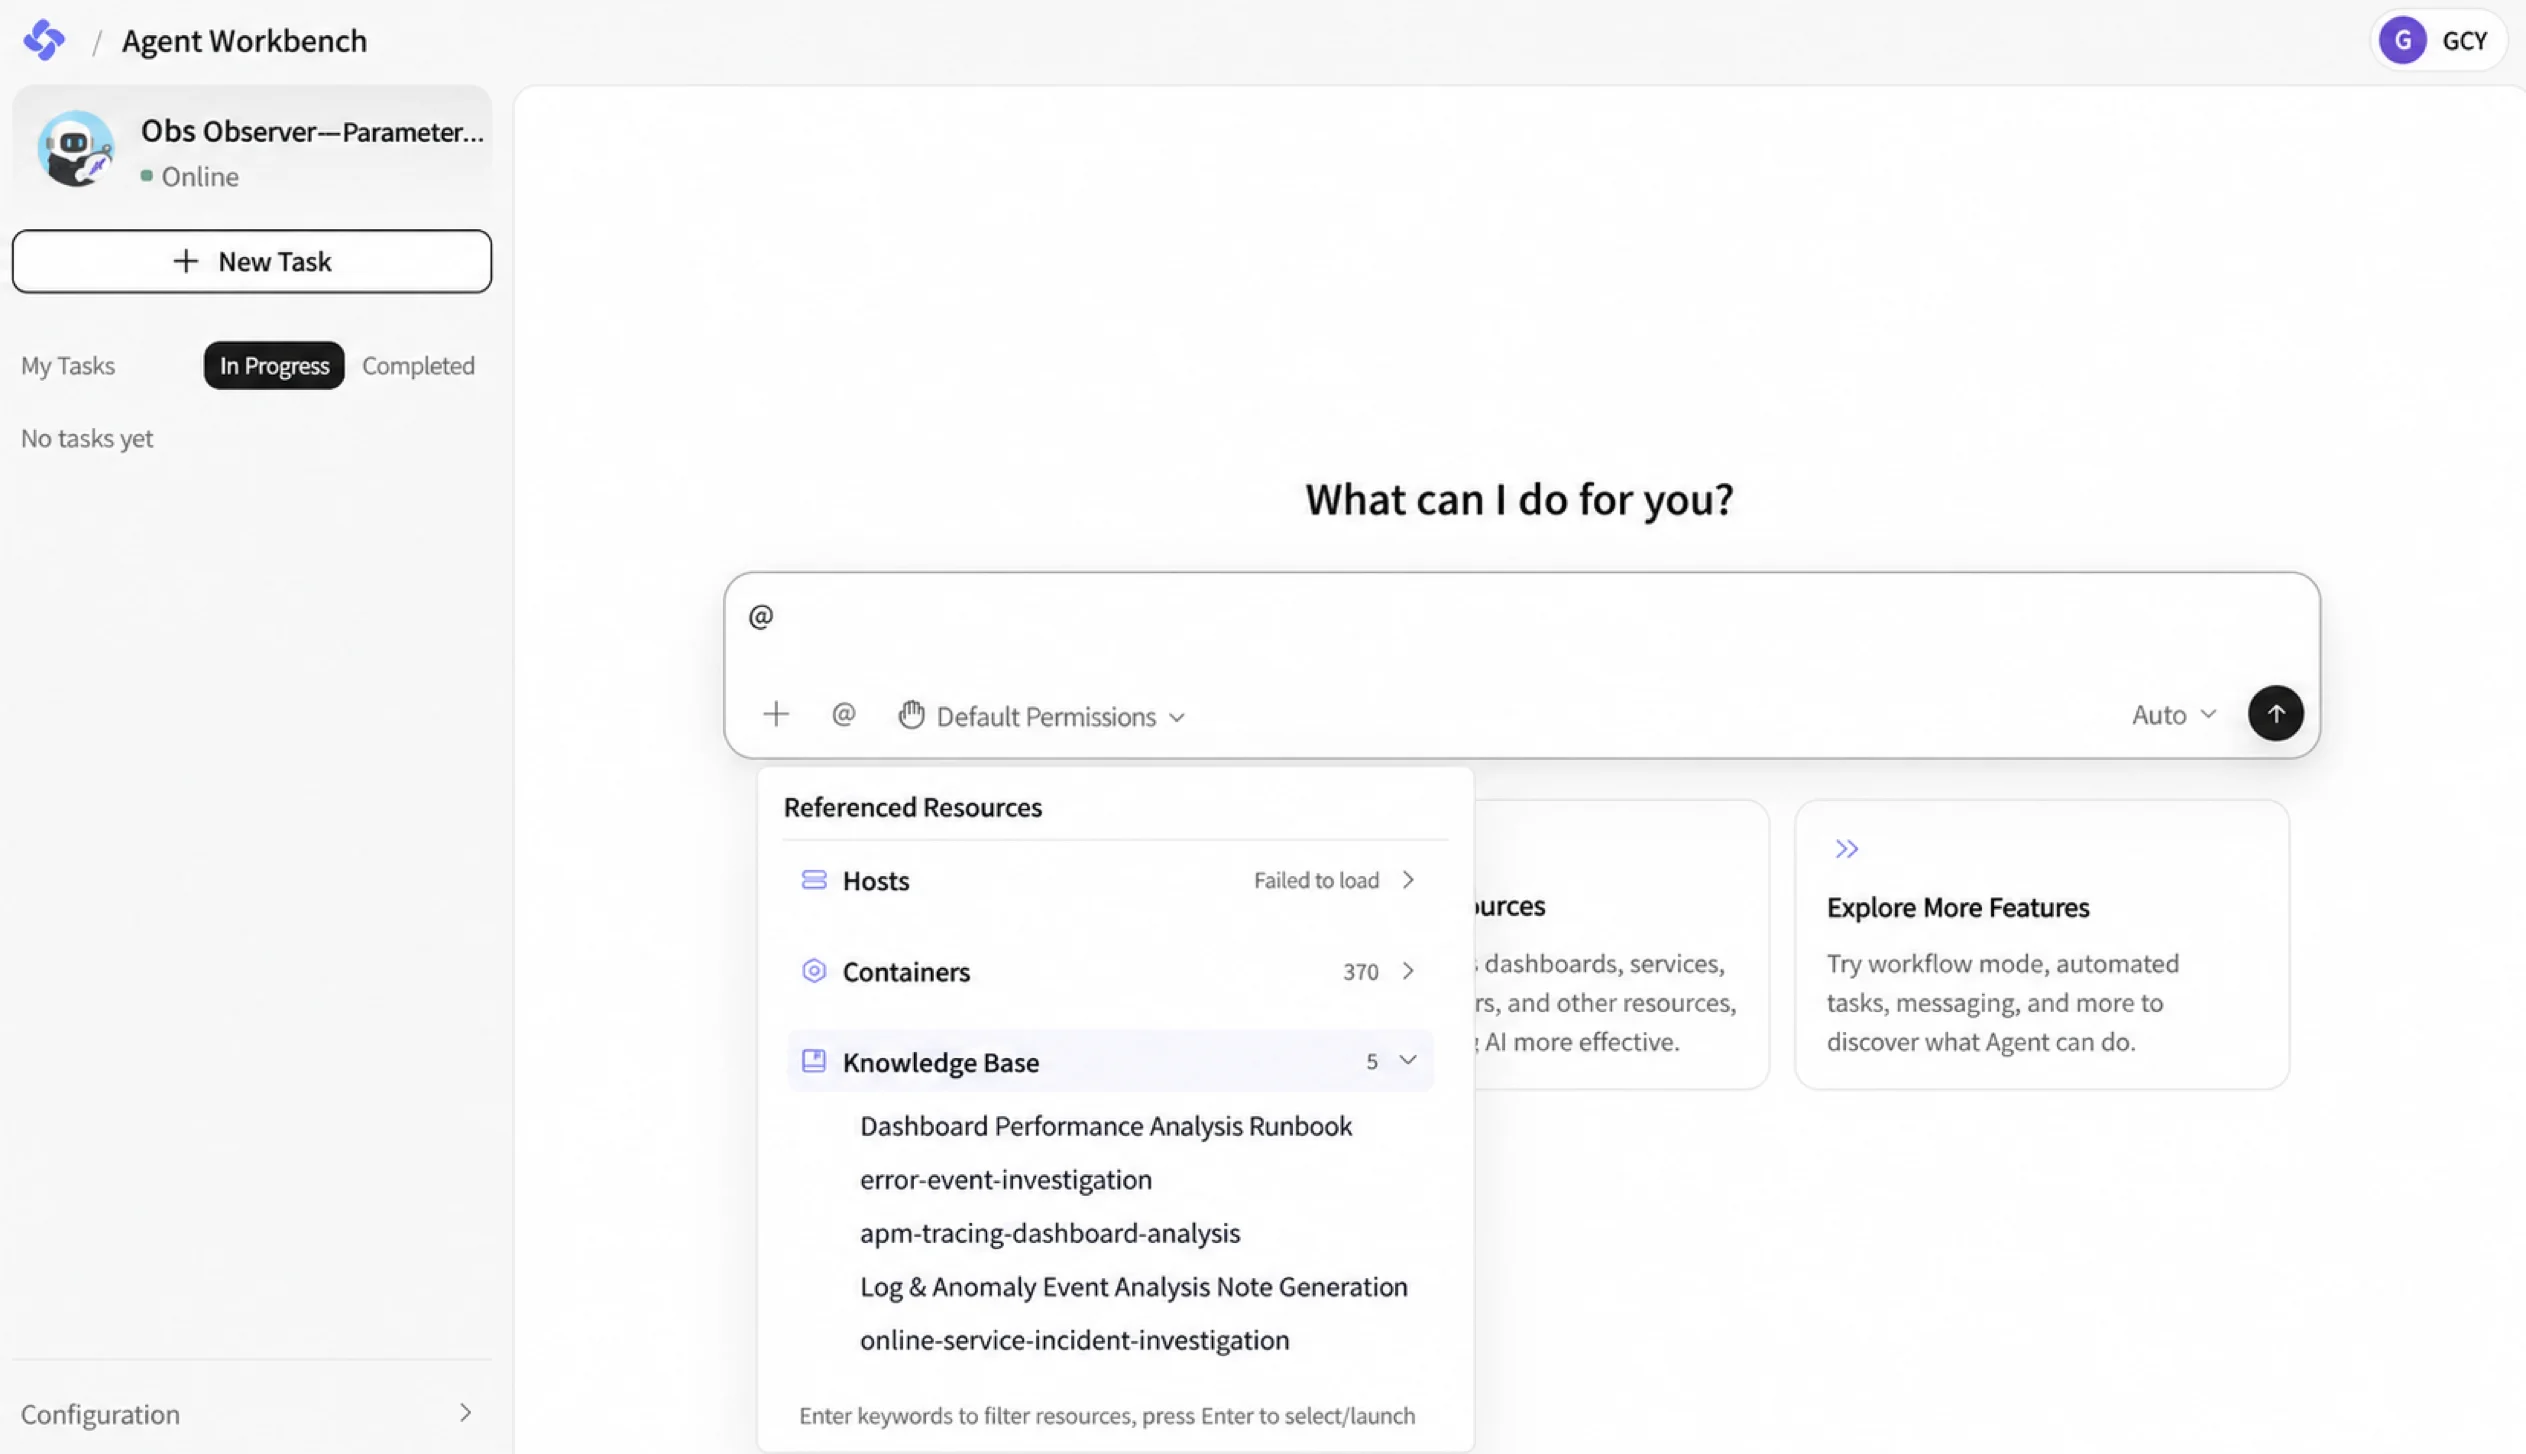
Knowledge base references in tasks
The @ resource list in a task now includes a knowledge base type. Agents can reference knowledge content directly, expanding the context available during task execution.
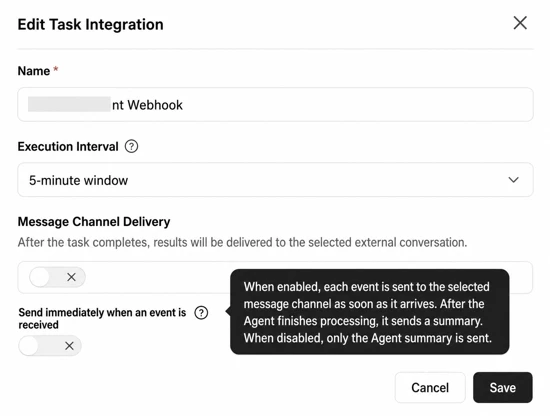
Instant event message forwarding
After an Agent receives a workspace event, it can forward the raw event to an IM group immediately with a note that analysis is in progress, then follow up with the analysis result.
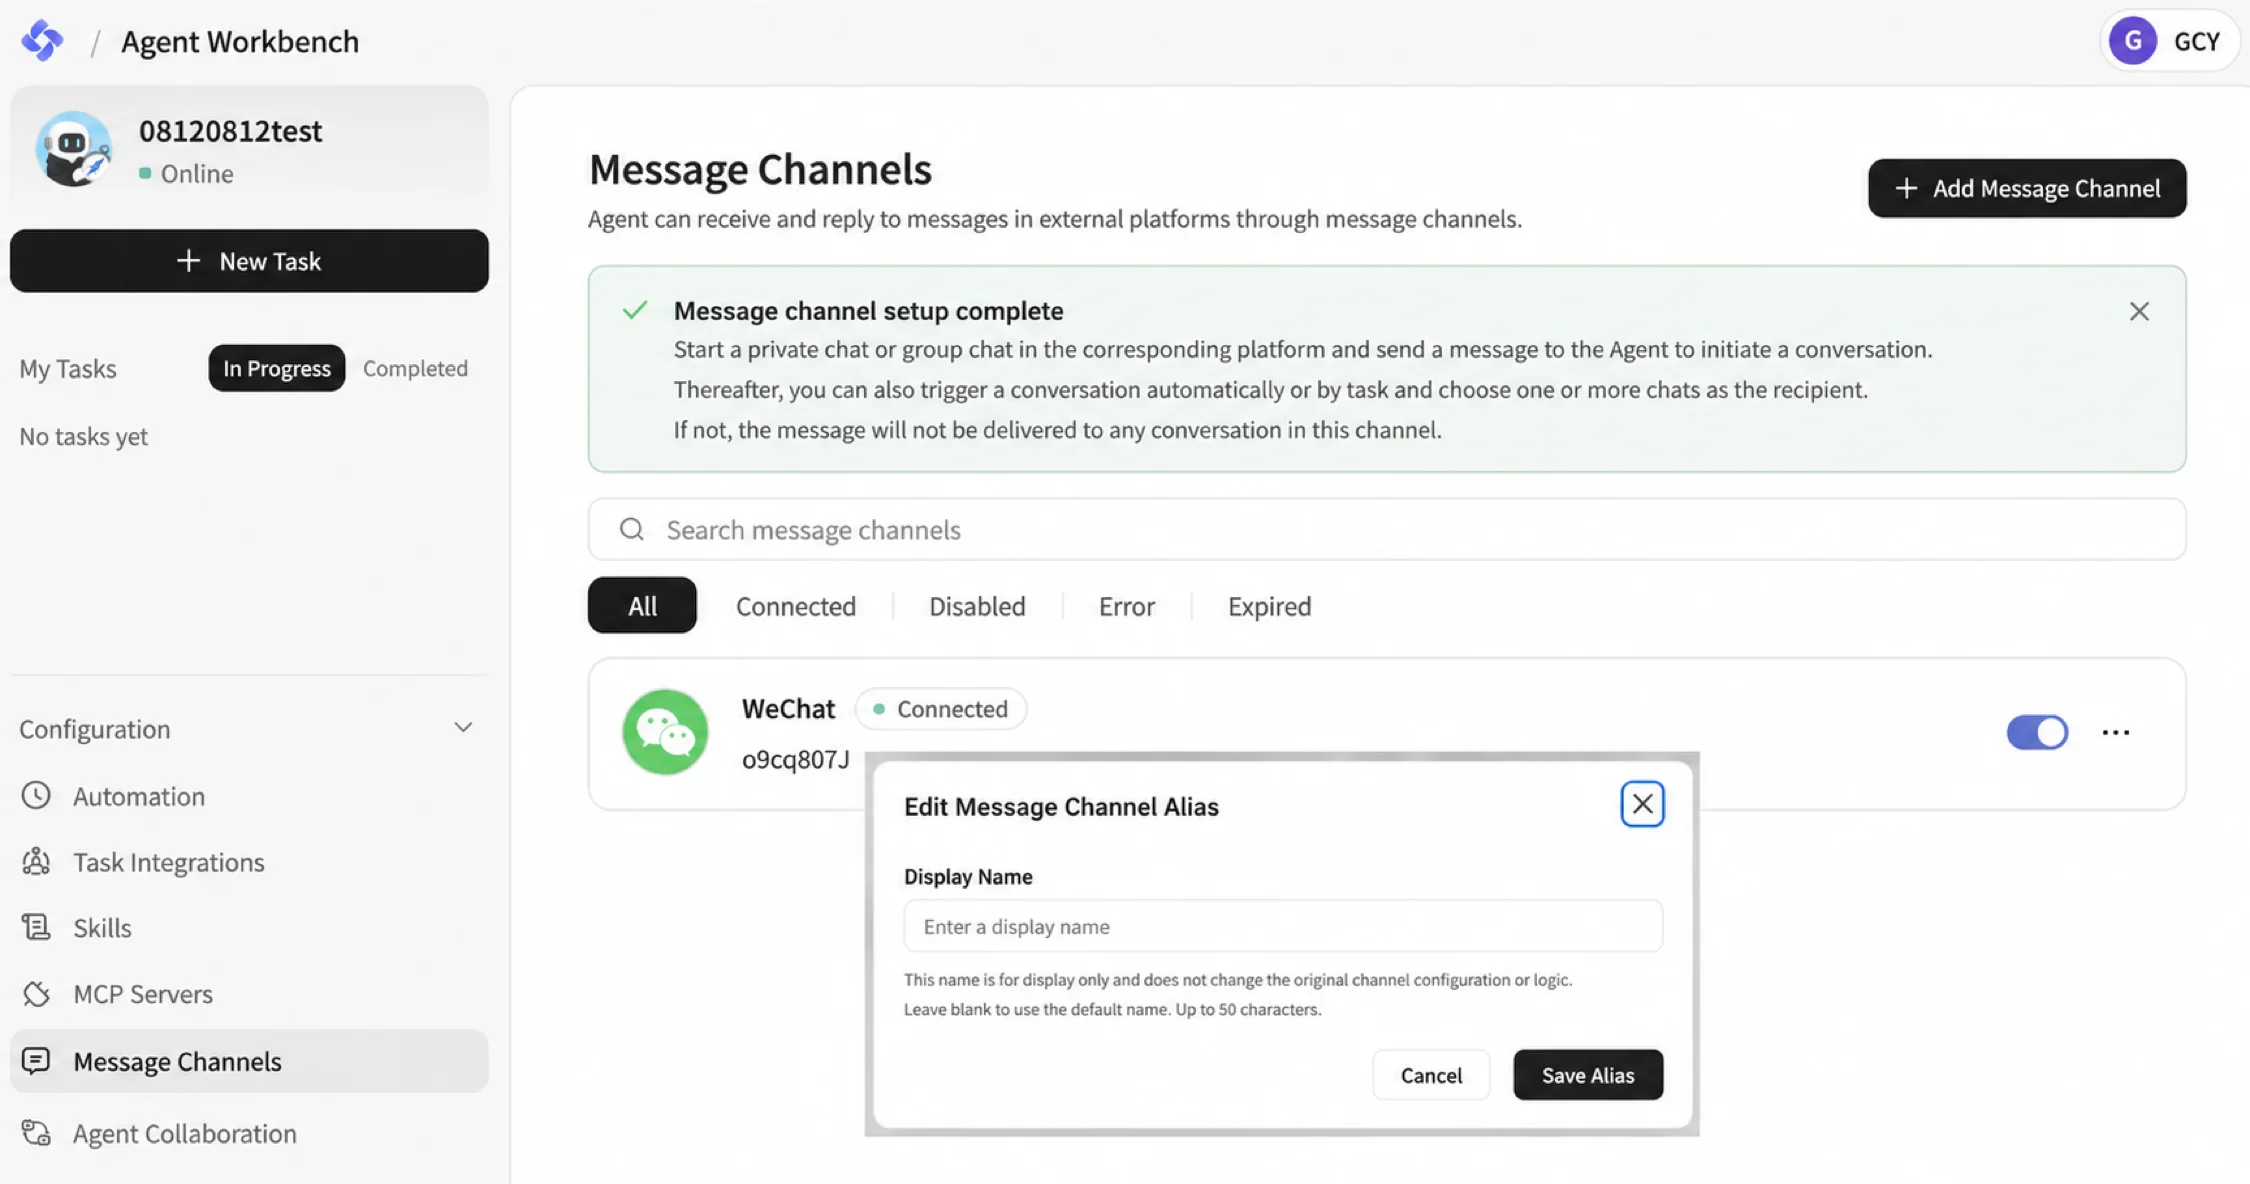
Session aliases for message channels
WeChat message channel sessions now support editable aliases, which solves the problem of sessions returning unreadable IDs that are hard to identify.
Logs
Log index query history
Query history is now recorded for multi-index queries, with multiple index names displayed as a comma-separated list.
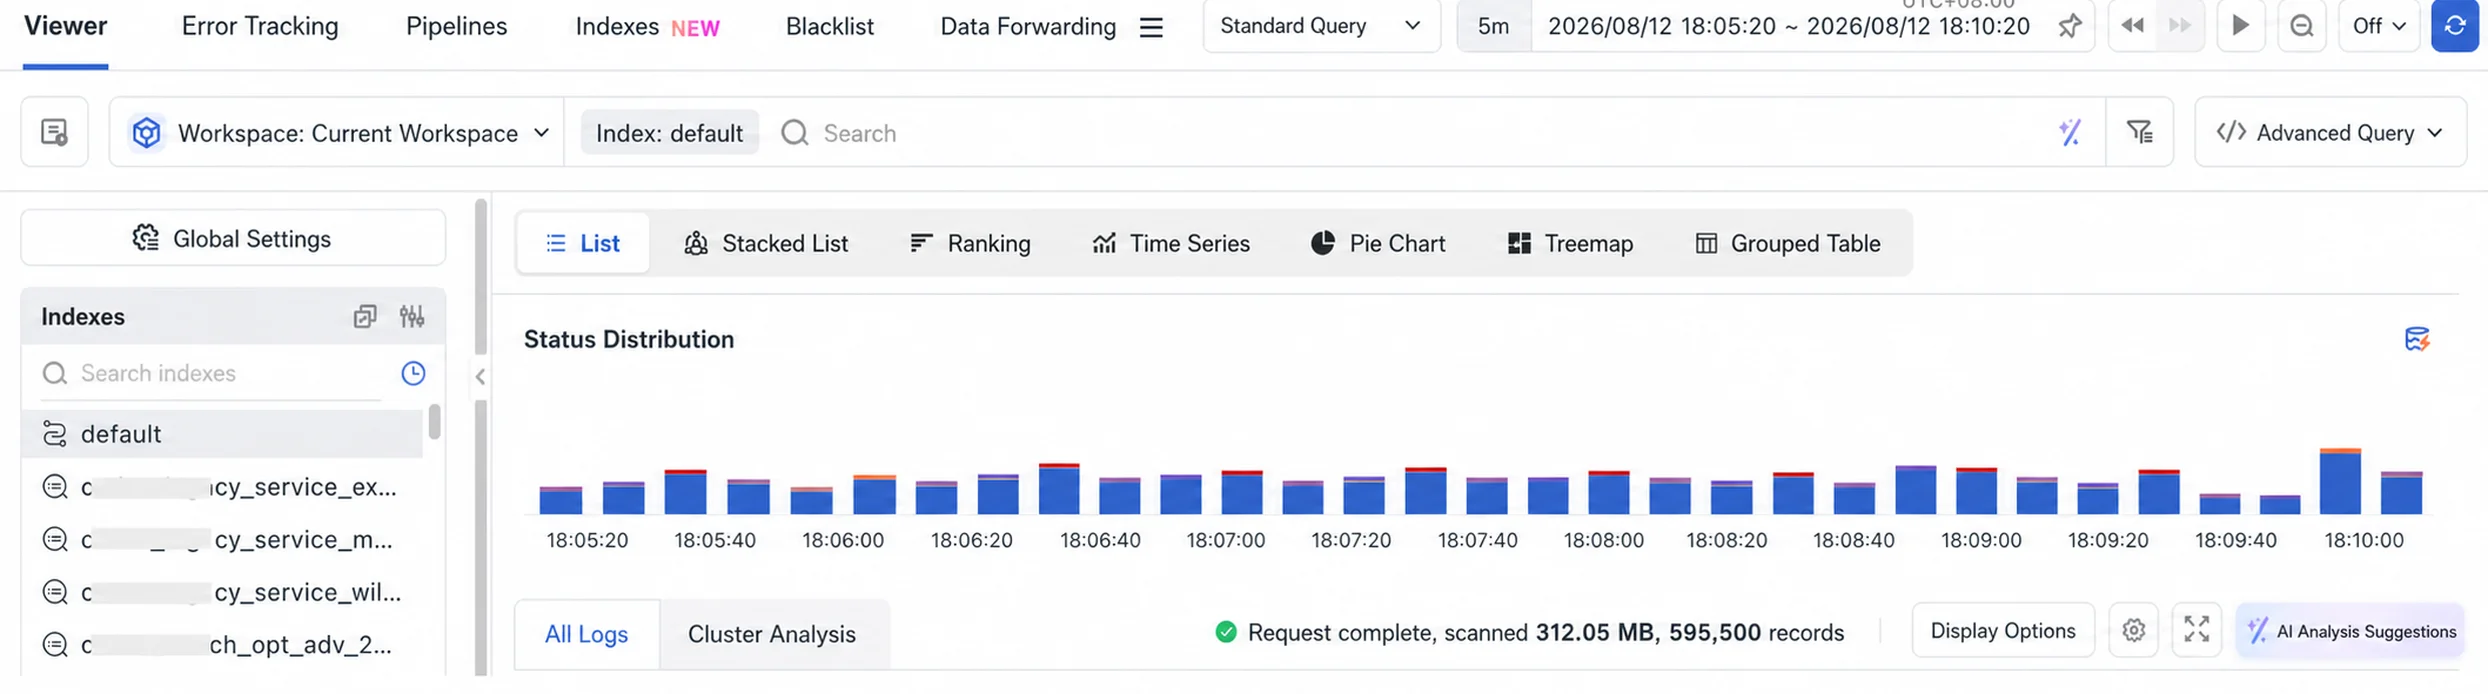
Per-index display field settings
Display fields can now be configured and saved separately for each log index, so changing the display fields of one index no longer affects the others. Full-row mode shows business fields by default instead of always showing the message field, and log details render dynamically based on the business field combination.
Enhanced search hints
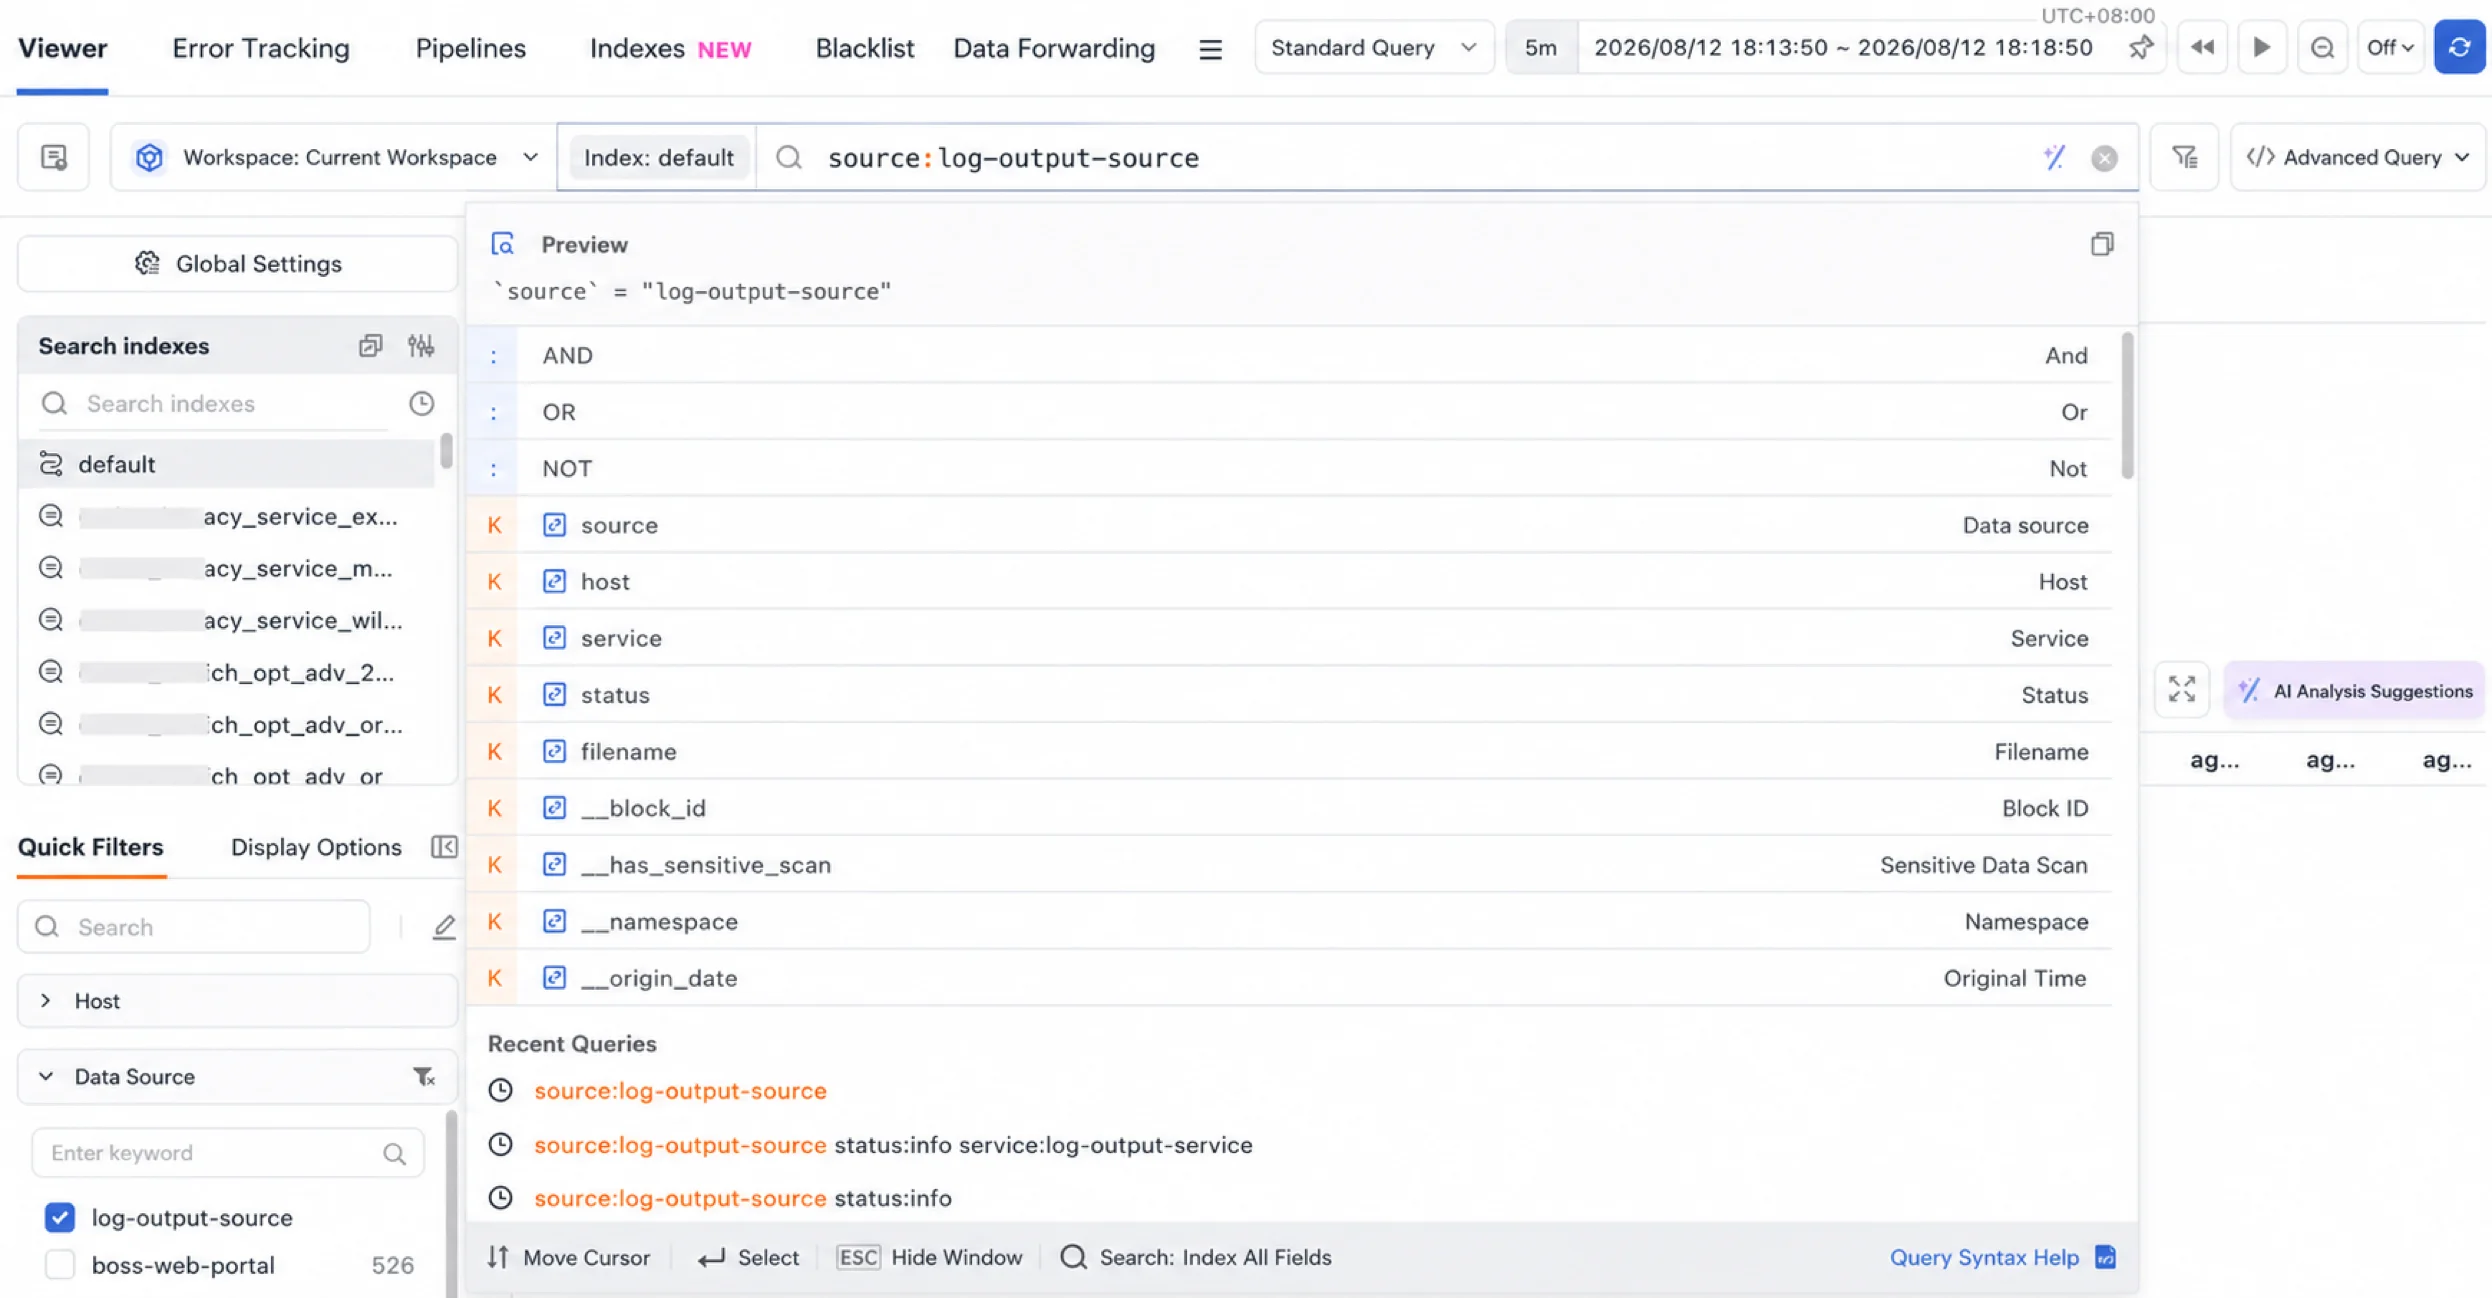
The log search box now suggests common logical operators such as AND and OR, helping users compose combined query conditions faster.
Enhanced CSV export
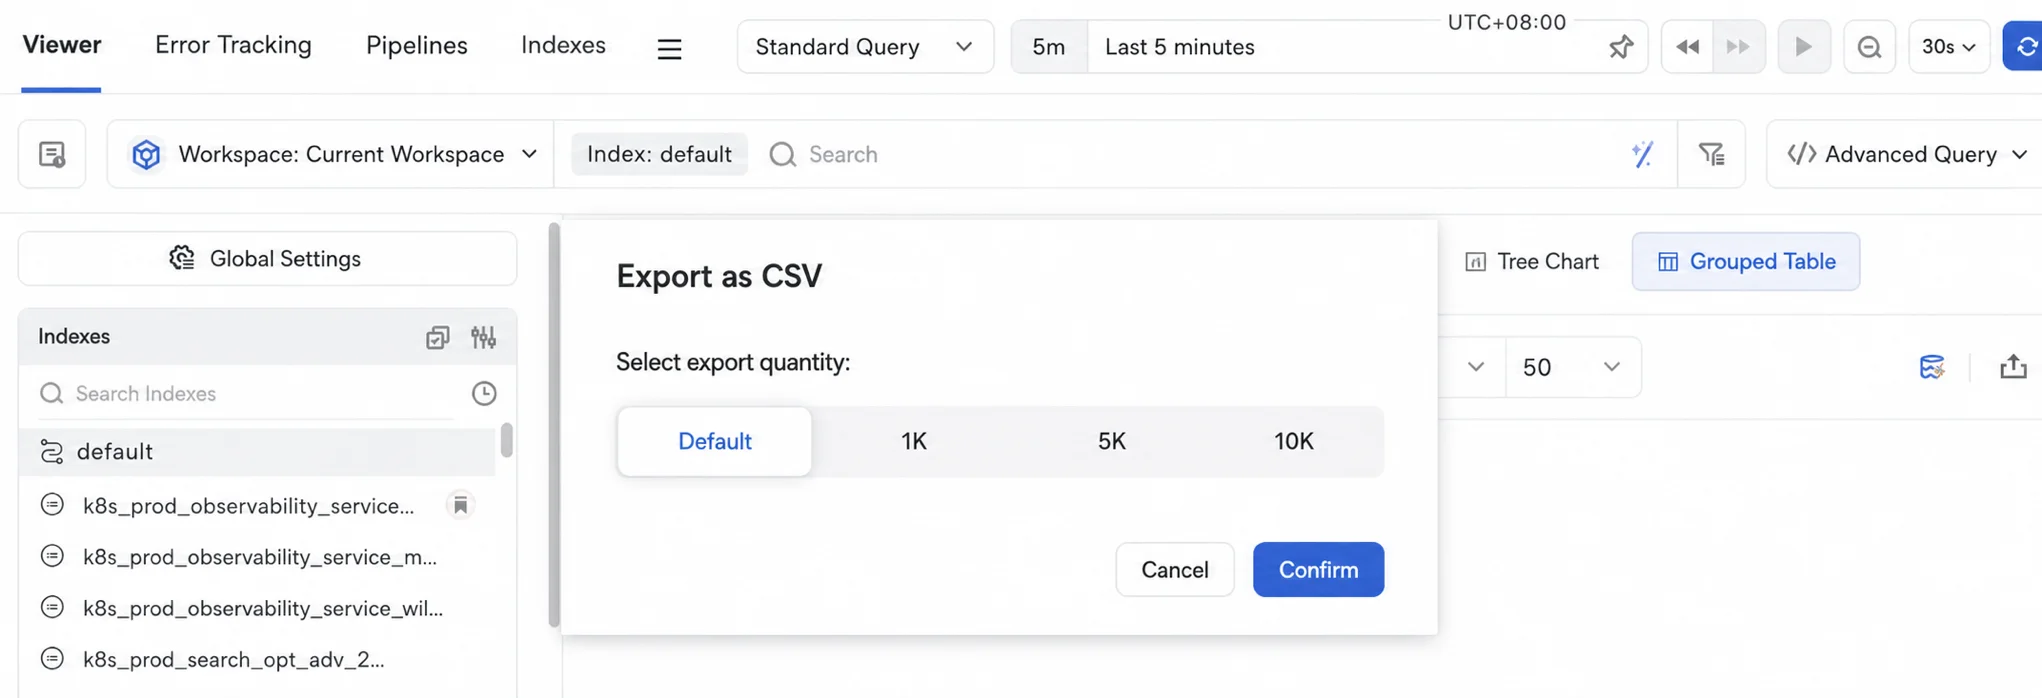
The export menu for grouped table charts now distinguishes Sampled CSV Export from Full CSV Export. Full export adds 5,000-record and 10,000-record options, and neither the 5,000-record nor the 10,000-record export applies sampling.
Application Performance Monitoring and User Access Monitoring
Explorer interaction improvements
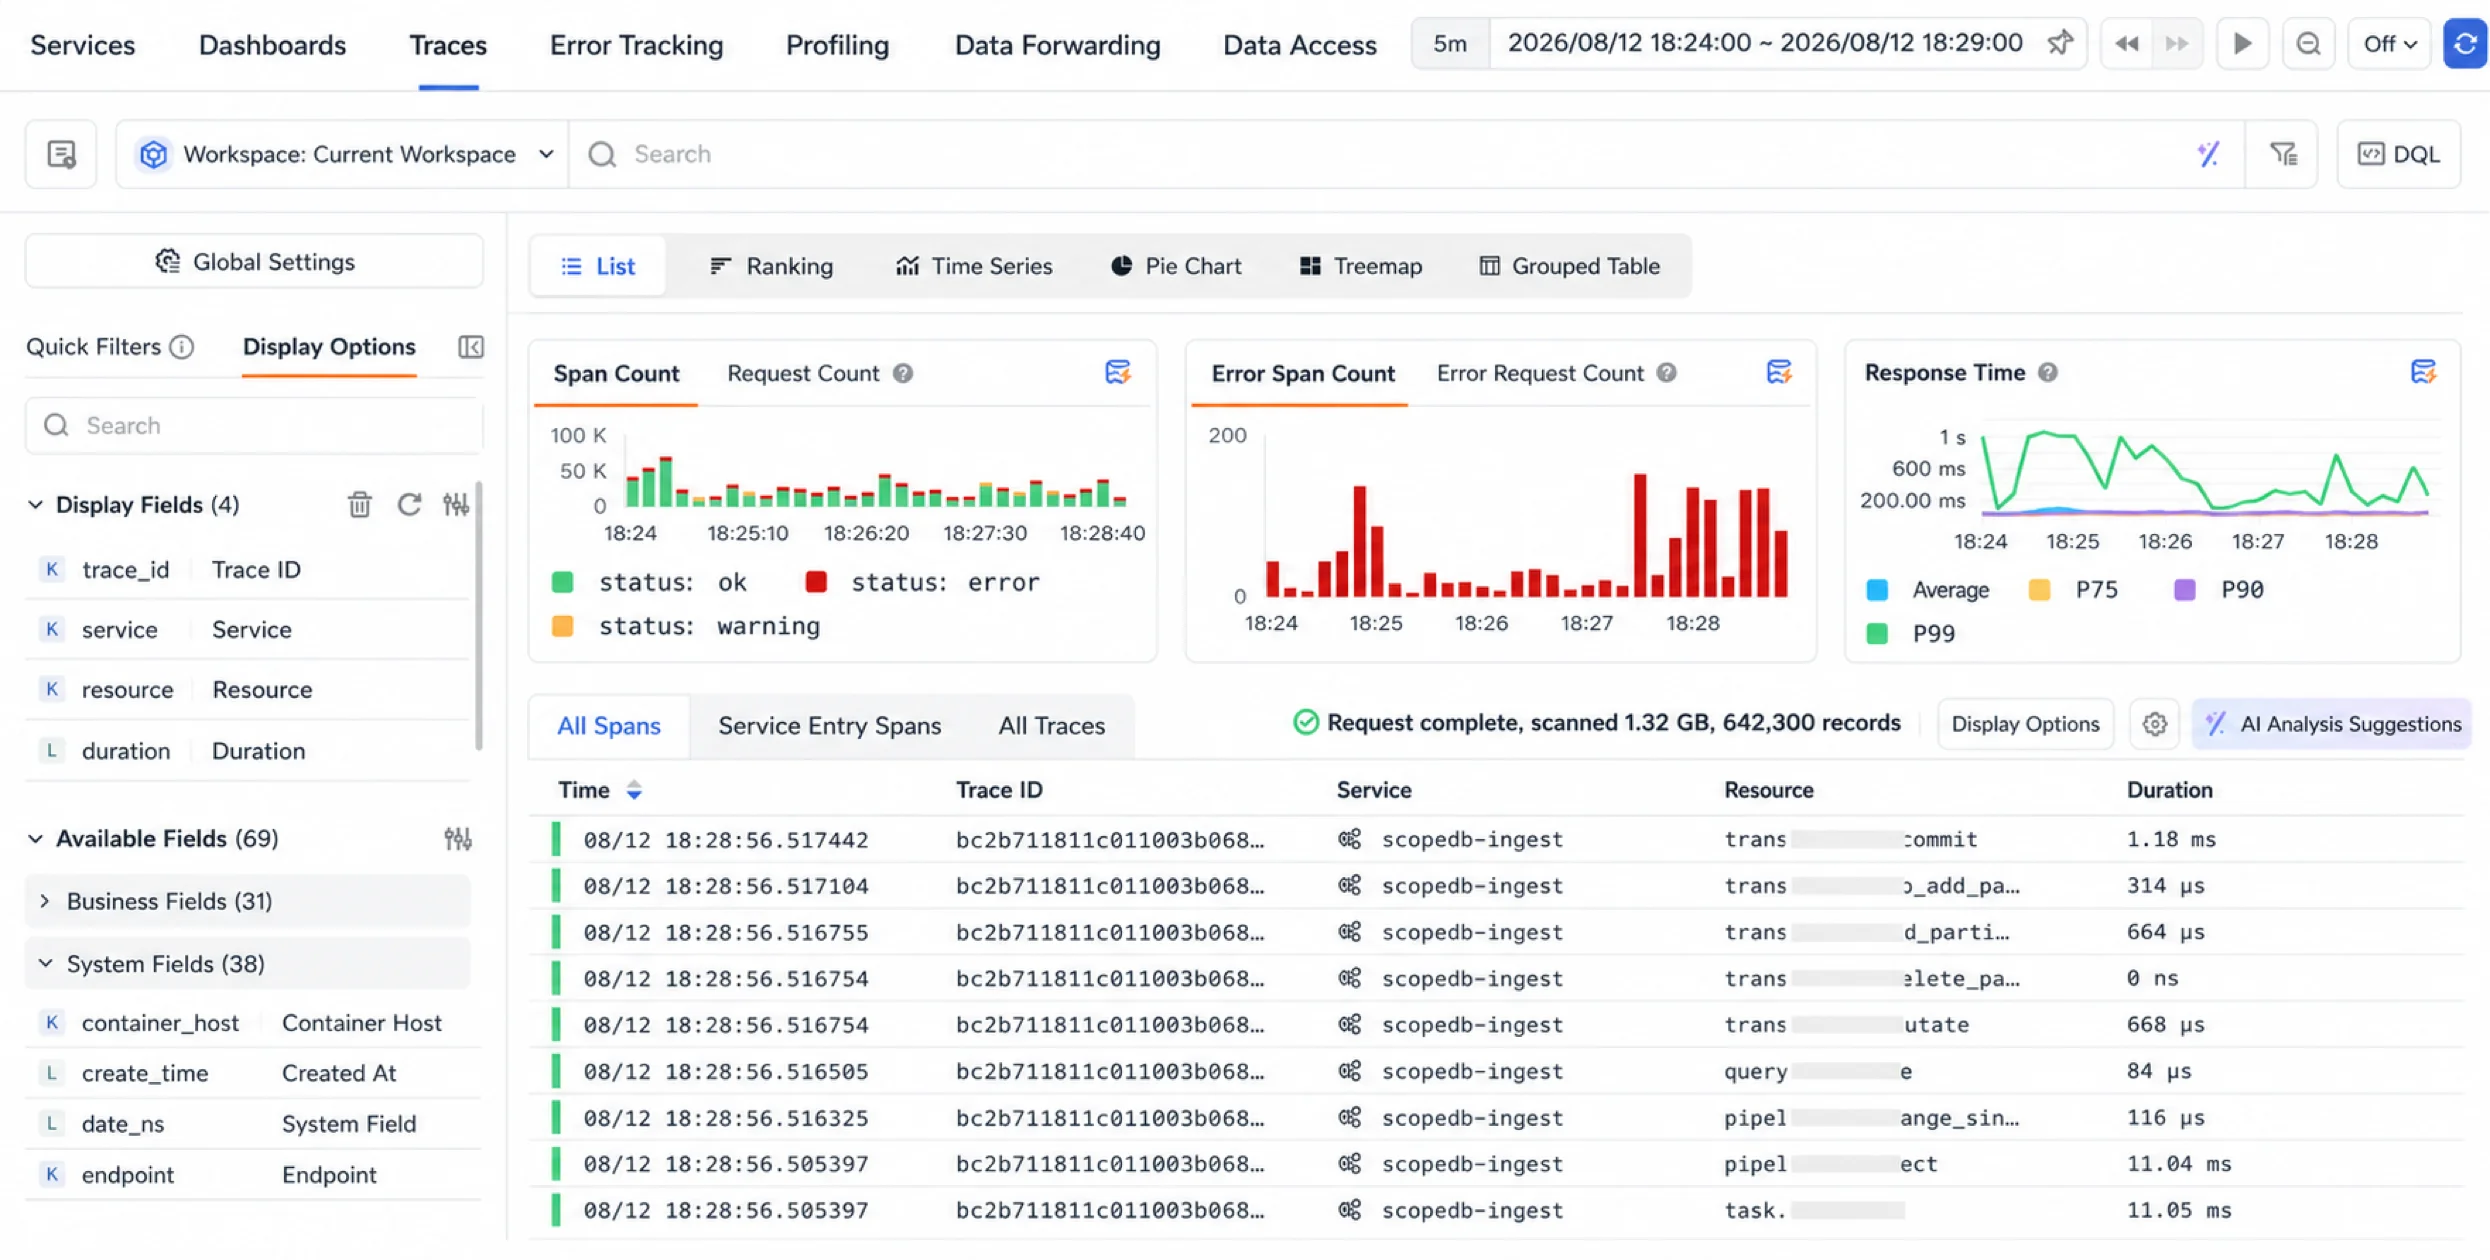
Explorers now support quick filters and display field switching, making it easier to adjust which fields the list shows.
Agent Monitoring
New User analysis dimension
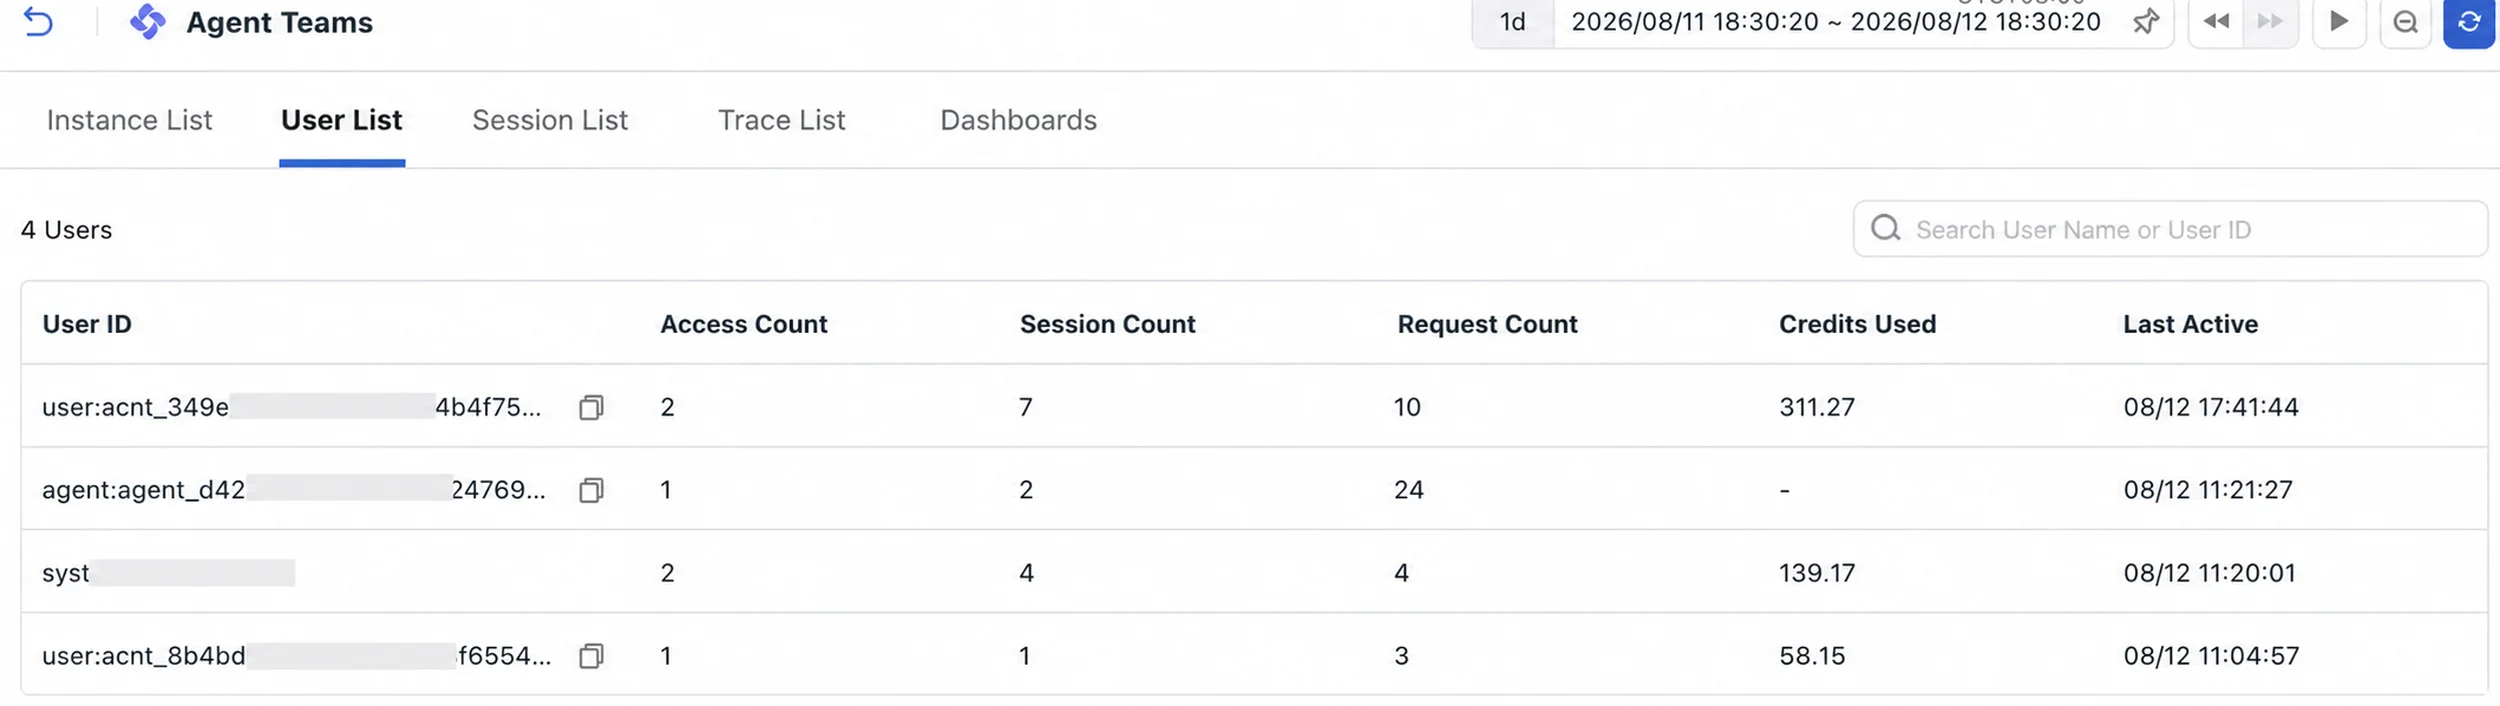
Agent Monitoring now supports viewing and analyzing data from the User dimension.
Skill execution share in call analysis
The Call Analysis tab on the session detail page now shows the execution share per Skill, making the distribution across Skills easy to understand.
Management
Daily metric data point cap
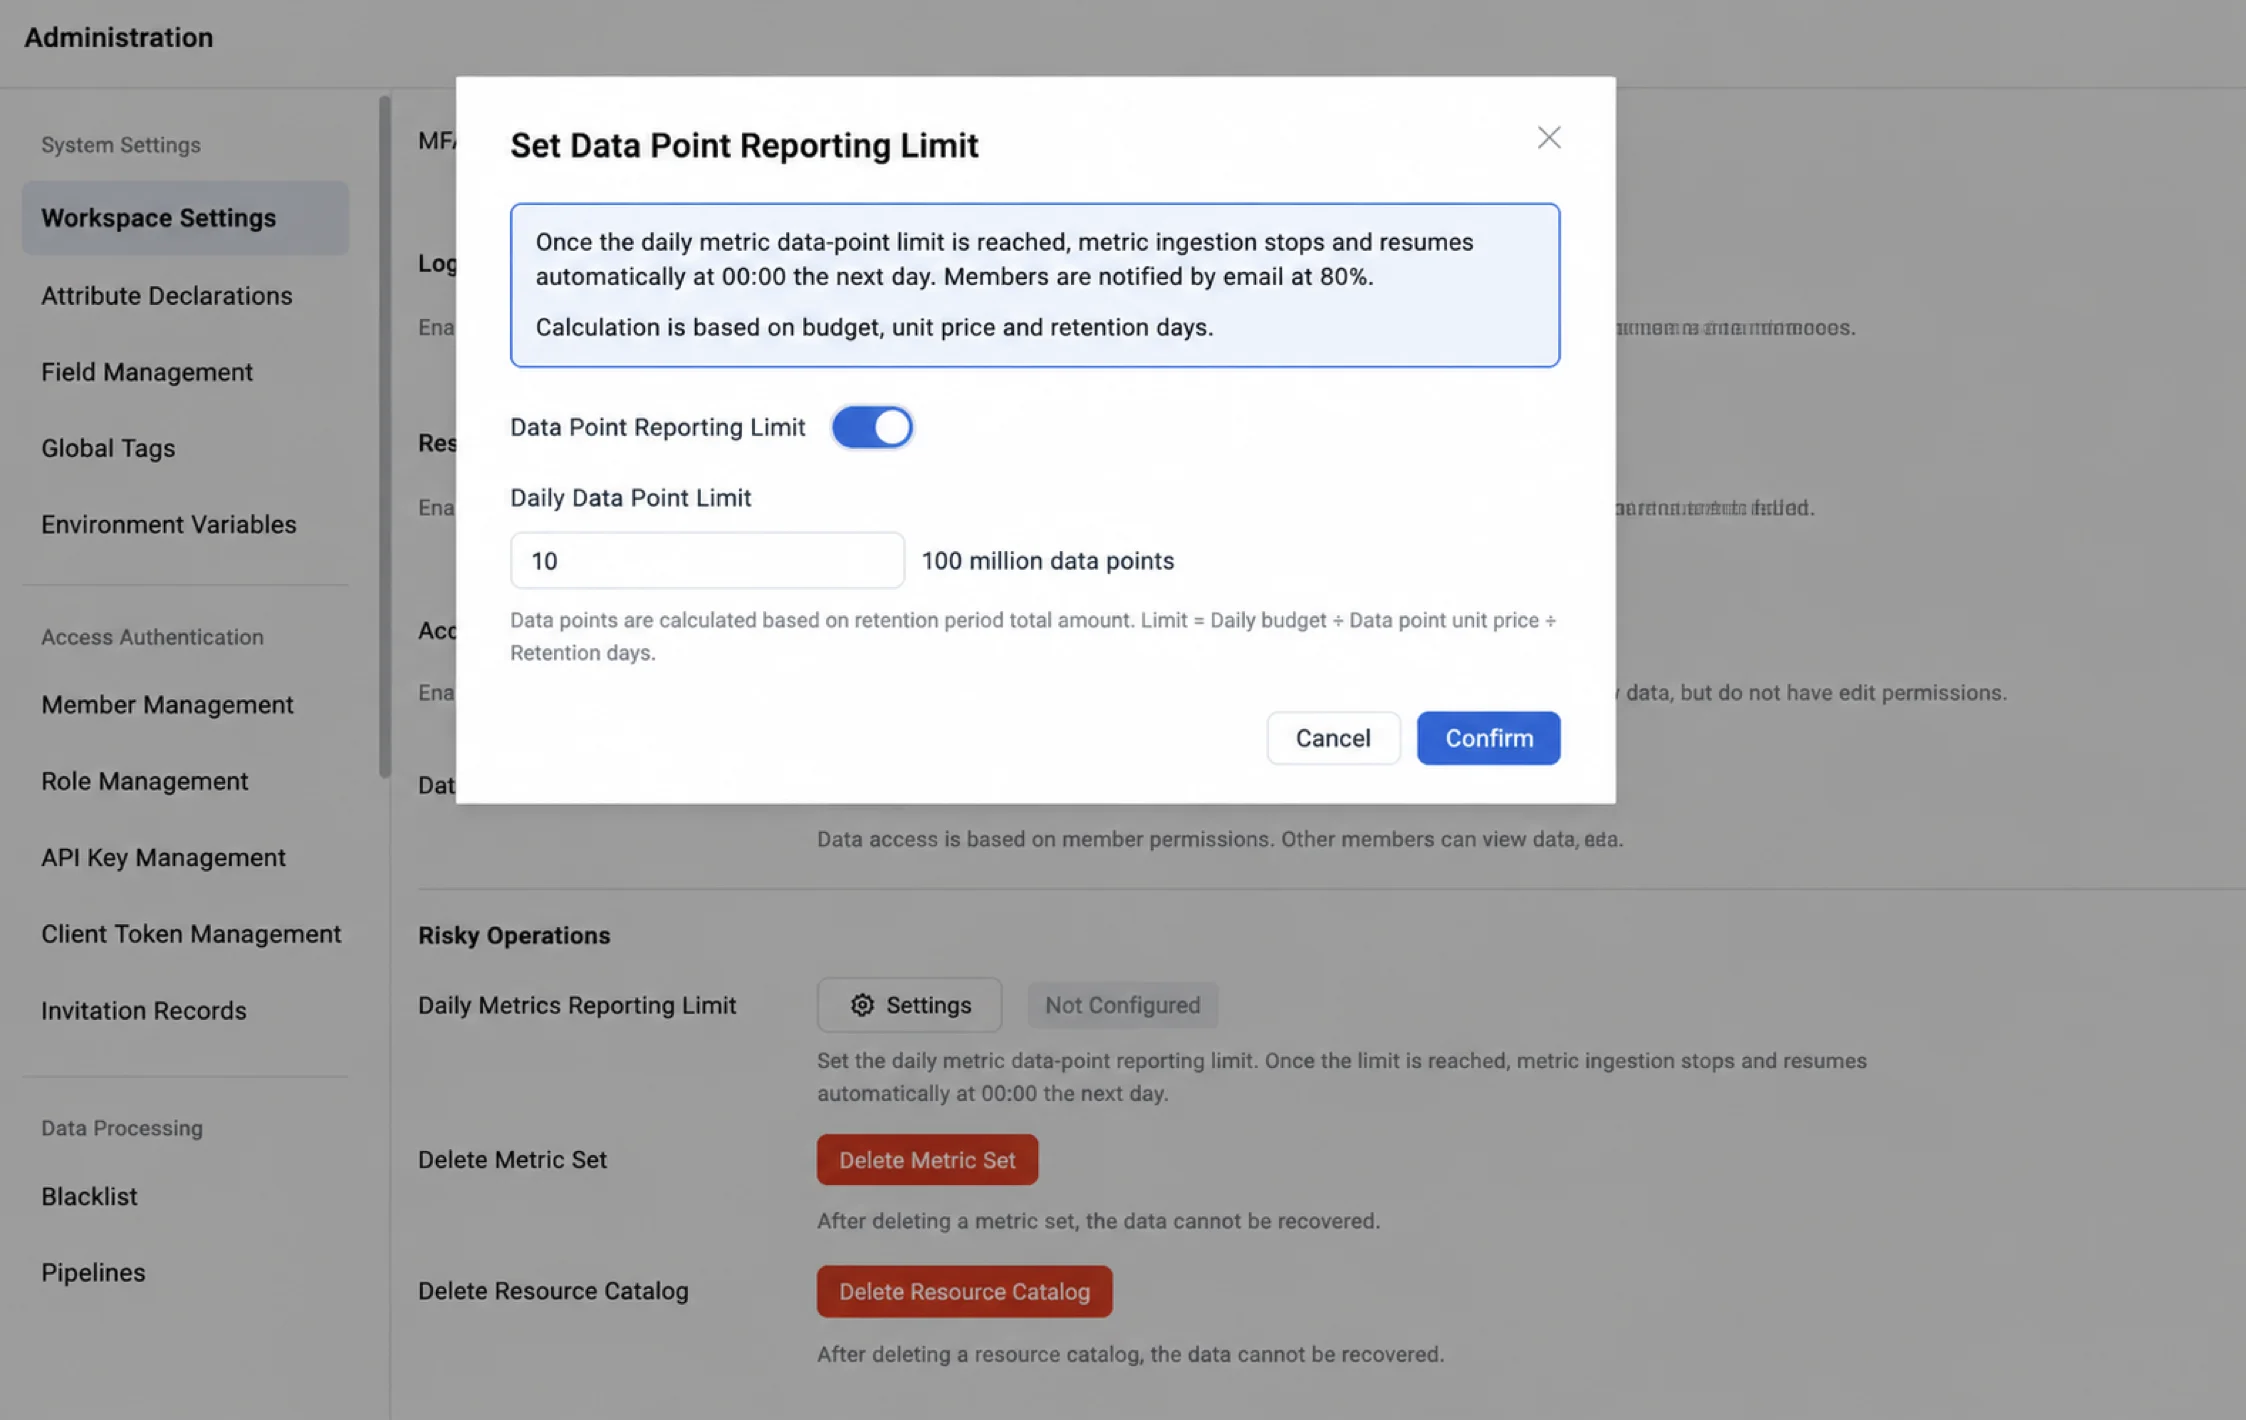
Management > Workspace Settings > Dangerous Operations now includes a Data Point Reporting Limit setting. Commercial workspaces billed by data points can set a daily cap on metric data points. Once the cap is reached, the system stops accepting metric data and resumes automatically at 00:00 the next day.
The configuration includes:
- A daily cap (in units of ten million data points) and the email recipients for notifications.
- An email notification at 80% of the cap; at 100%, data ingestion stops and a system event is generated.
- Secondary confirmation when enabling the setting; disabling it saves directly.
- Applies only to workspaces billed by data points.
- Only Owners, administrators, and roles with the Management > Dangerous Operations permission can change it.
Data Forwarding
Apache Iceberg storage format for AWS S3 archiving
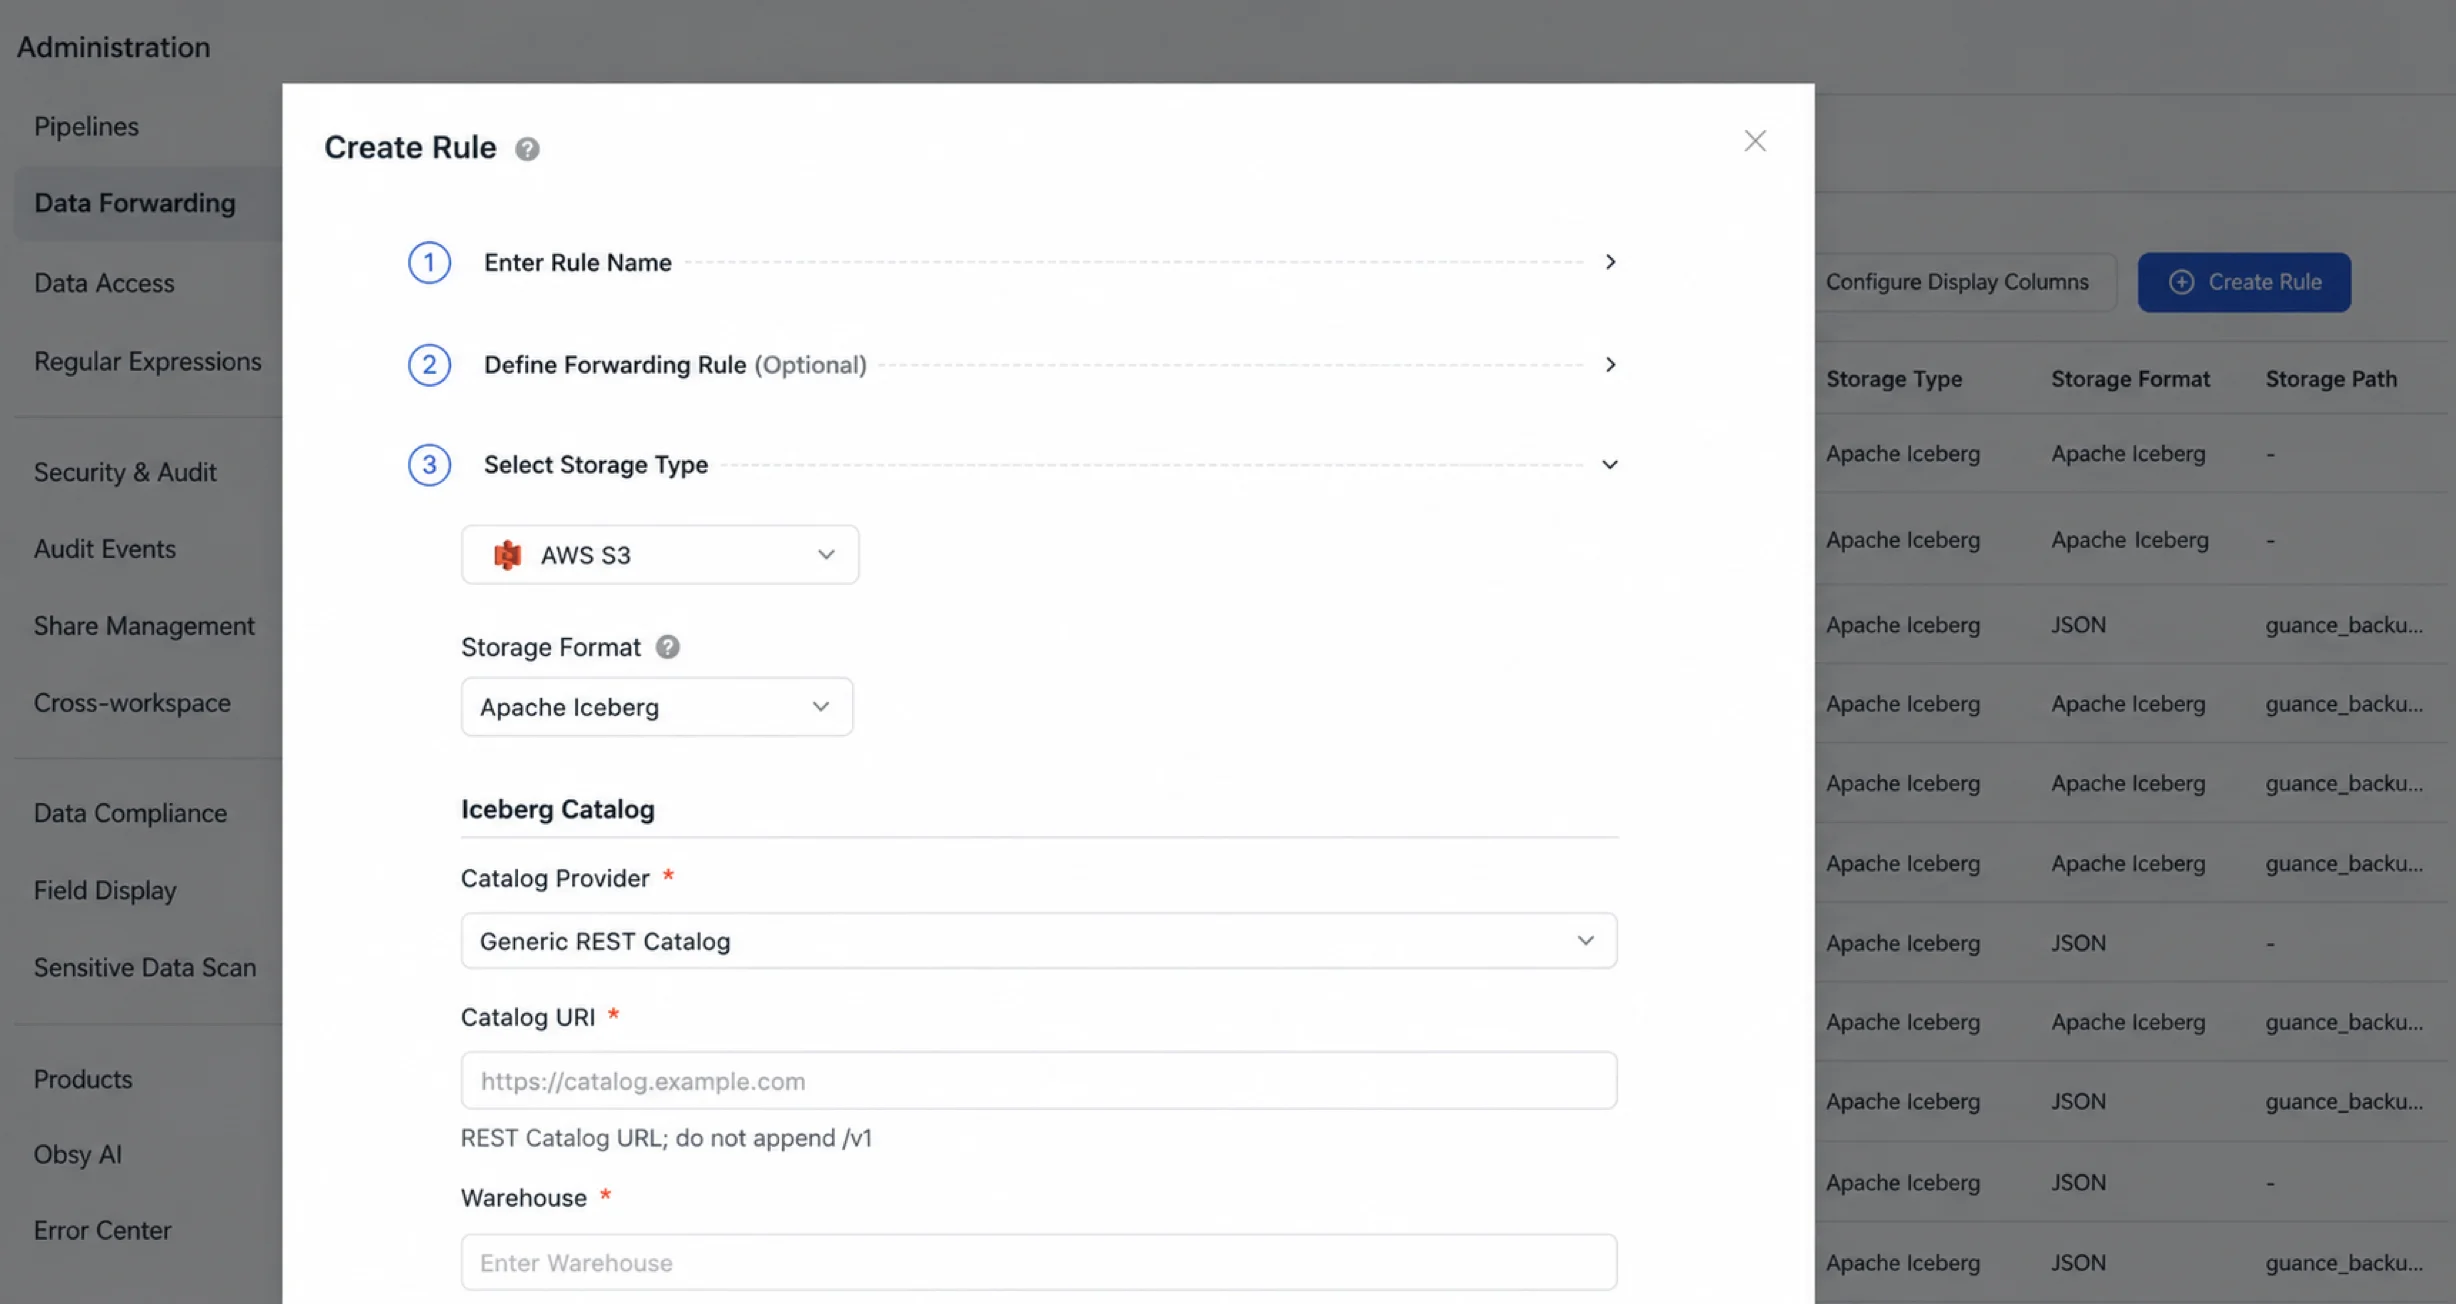
AWS S3 archiving now supports the Apache Iceberg storage format. Data is written to an external Iceberg table in Parquet format through a REST Catalog. TrueWatch creates the namespace and table automatically and partitions data by hour(date).
Notes:
- The Iceberg format currently supports writes only; archived data cannot be queried inside the platform.
- Data can be read by connecting an external query engine to the same catalog.
- The data forwarding rule list adds a Storage Format filter.
Unified Catalog
Custom entity health calculation with Func
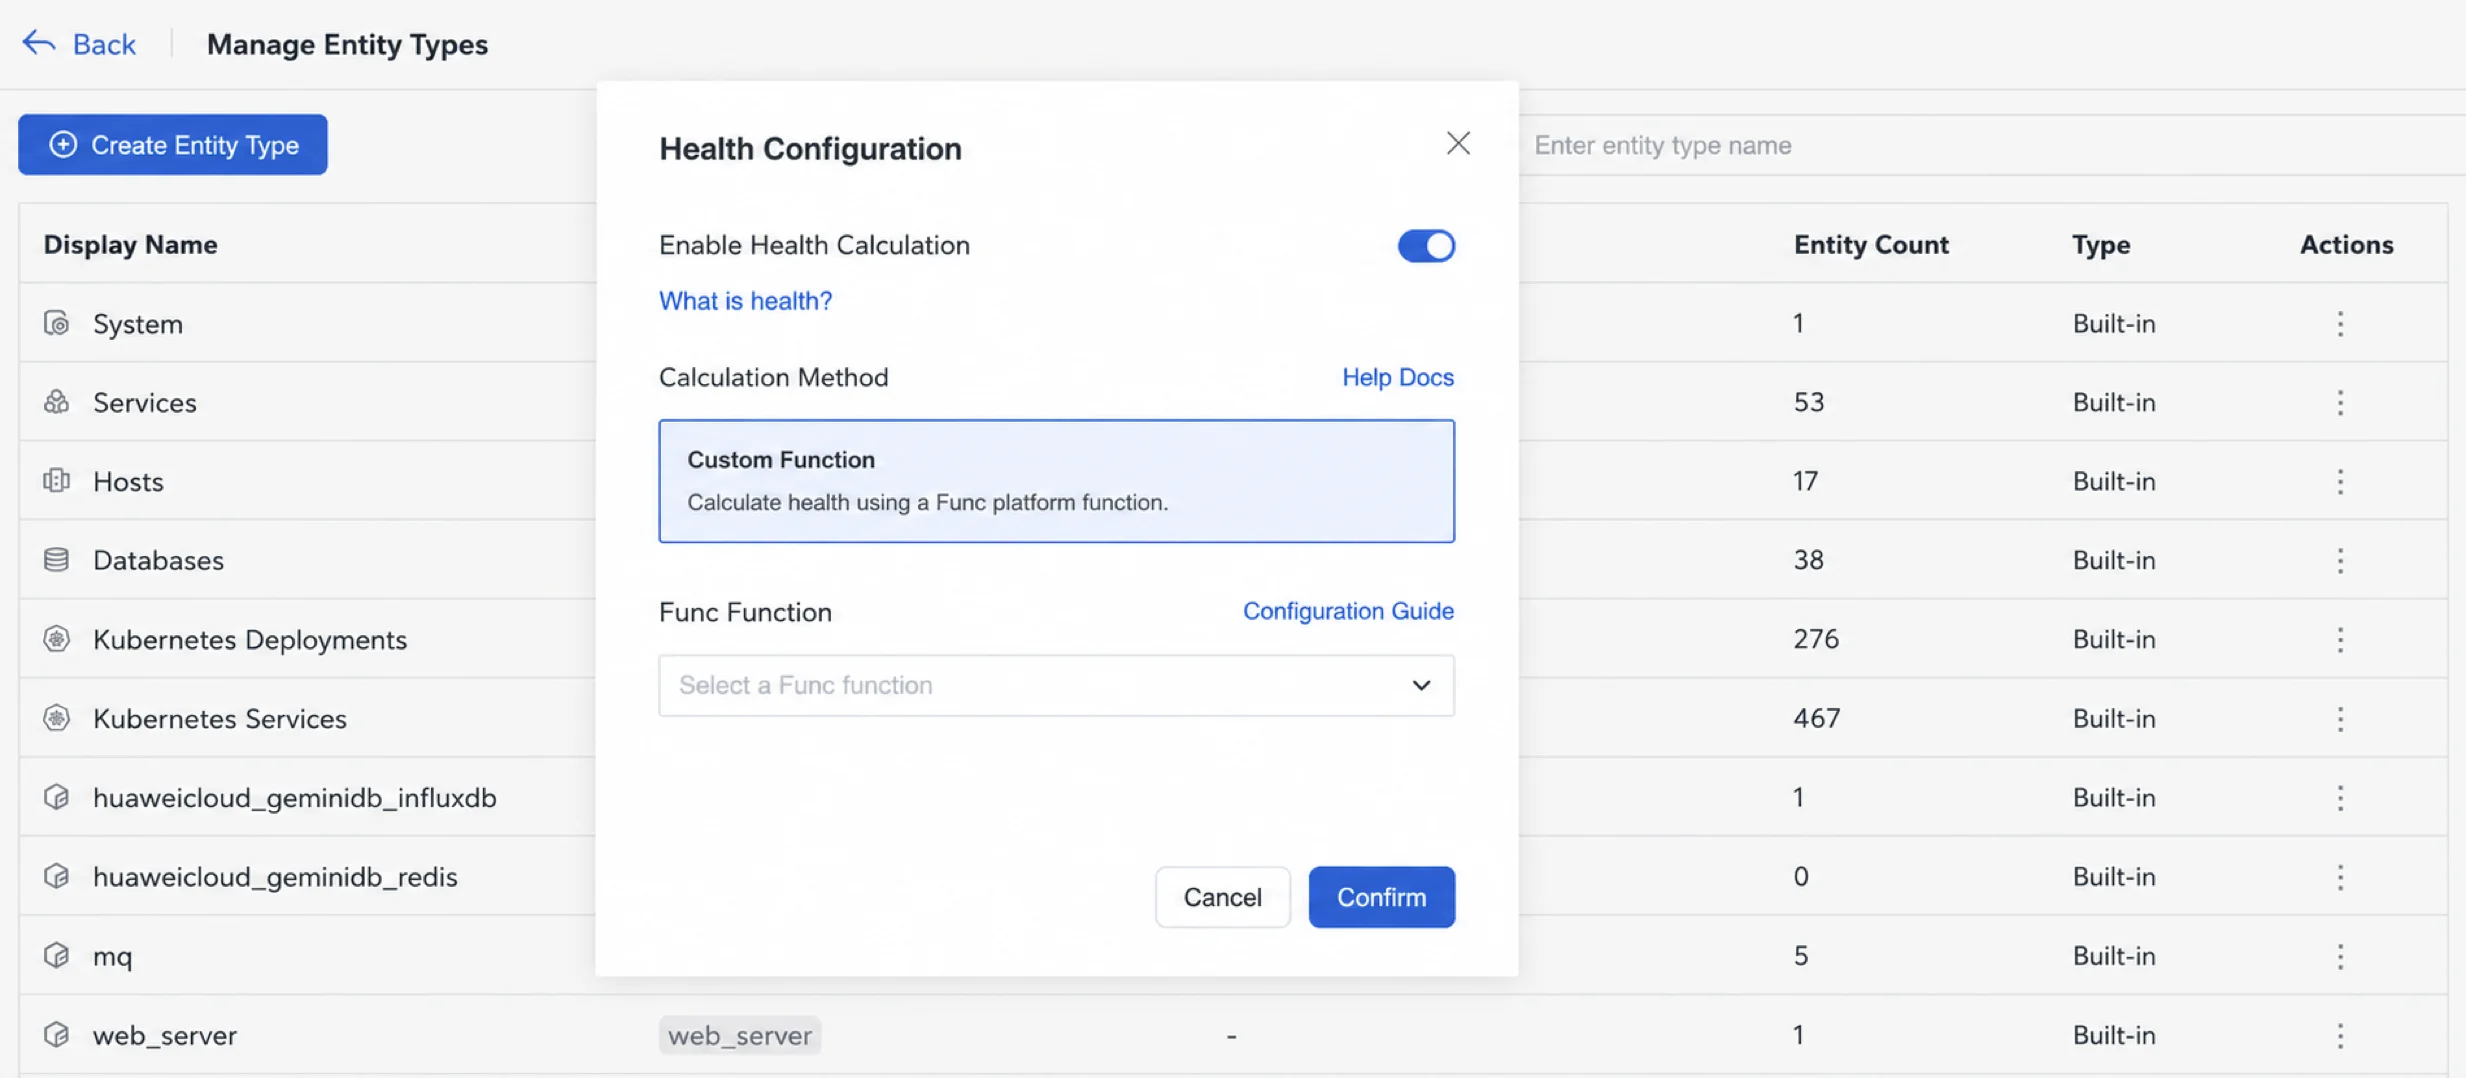
Entities of any type other than System can now call a Func platform function to calculate health. The corresponding entity type list page also adds a health status filter.
Infrastructure
Database query analysis
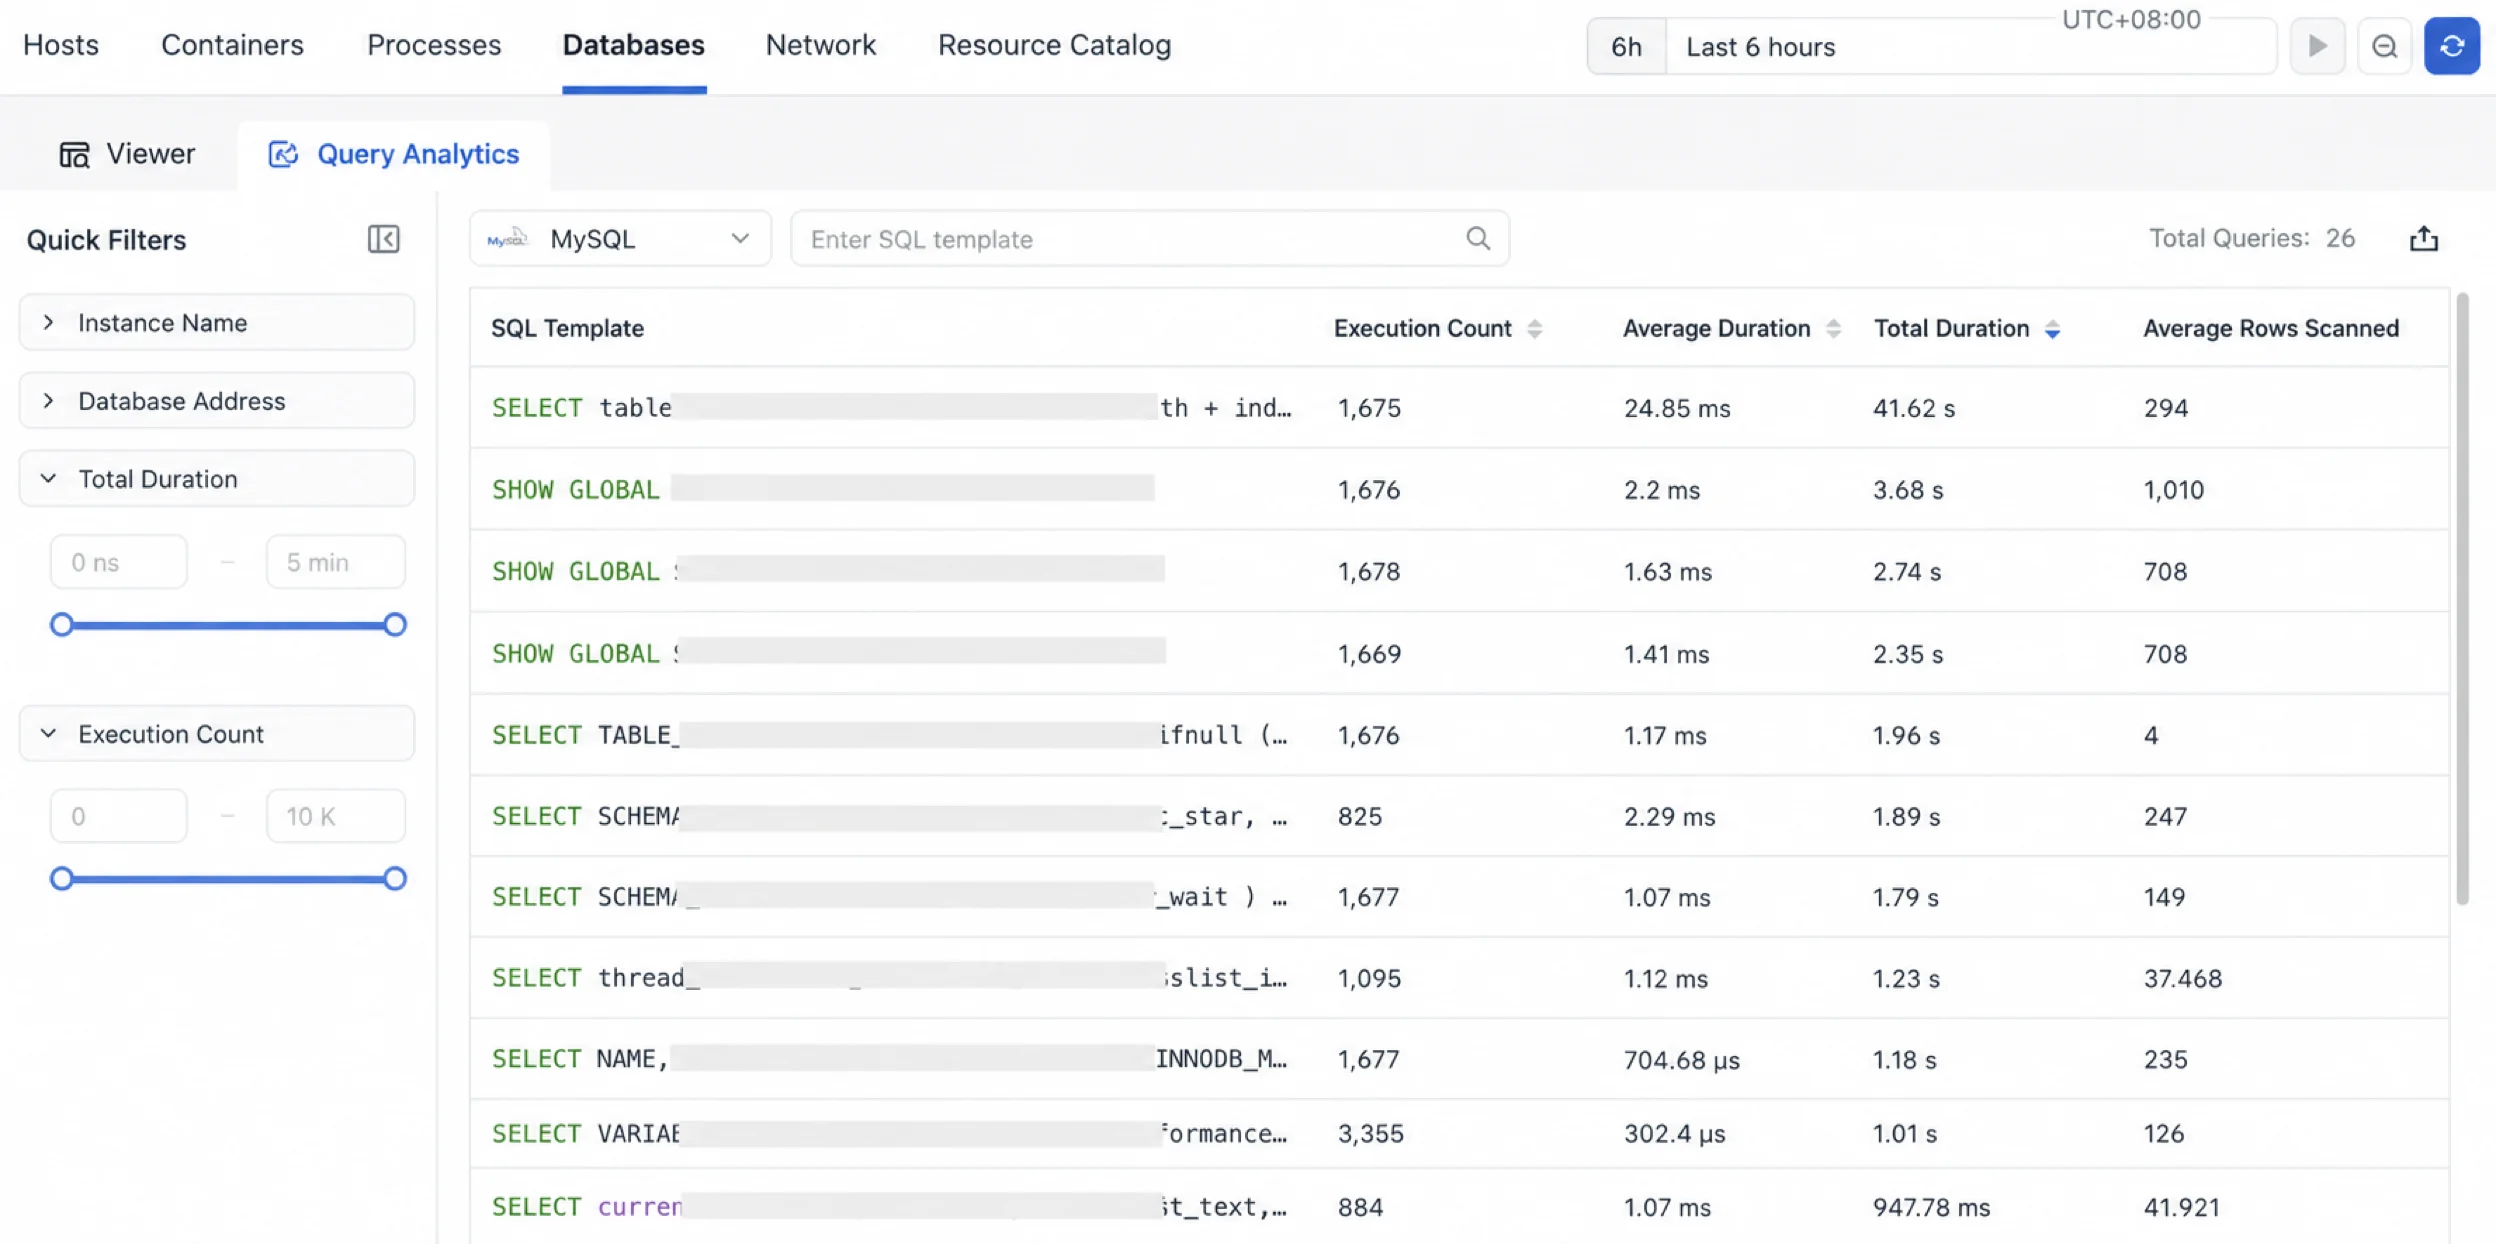
Databases now include a Query Analysis tab that aggregates normalized queries across instances, helping teams locate slow queries globally.
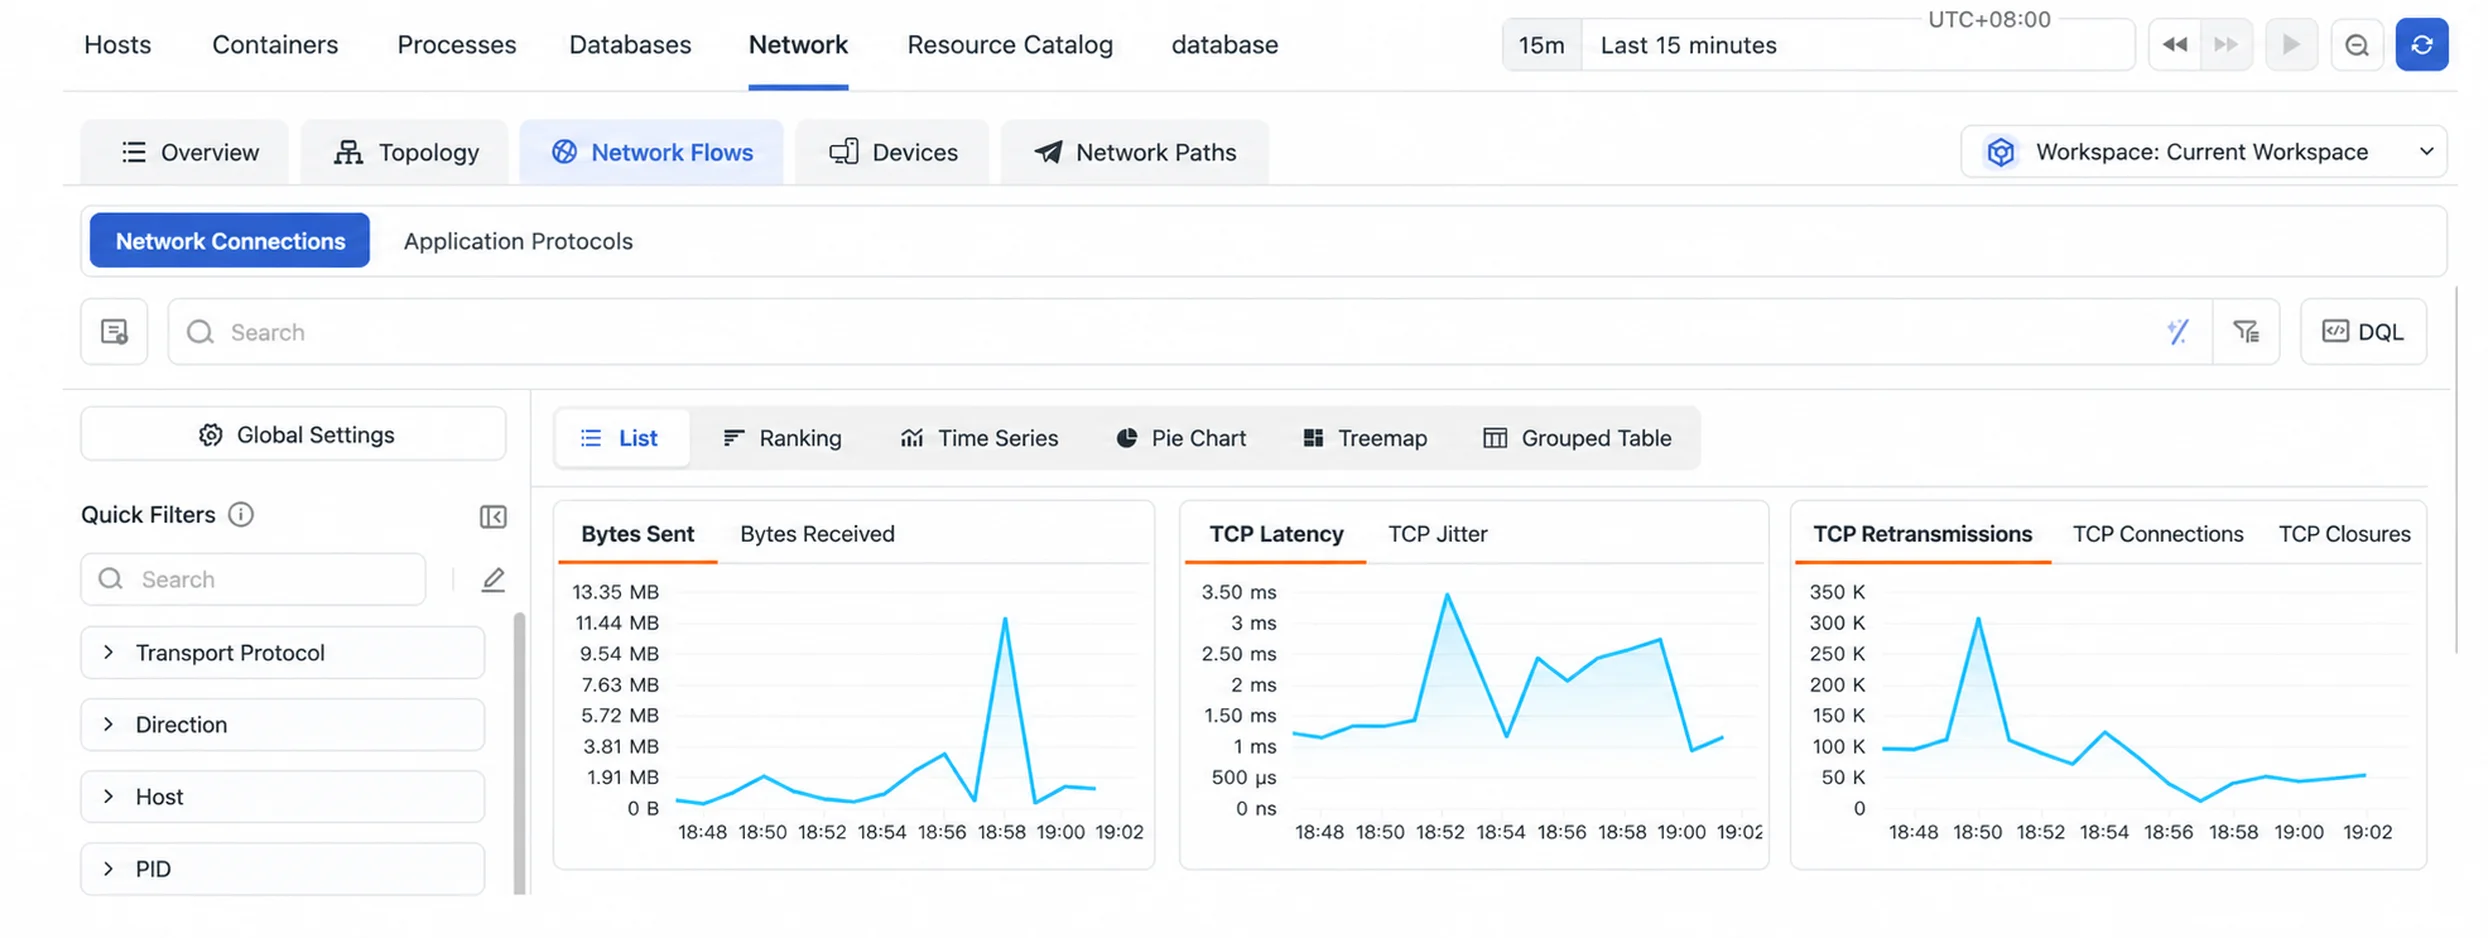
Network flow aggregation analysis
New aggregation charts present core metrics over time, including total requests, error rate, average response time, P99 response time, and status code distribution.
Monitors
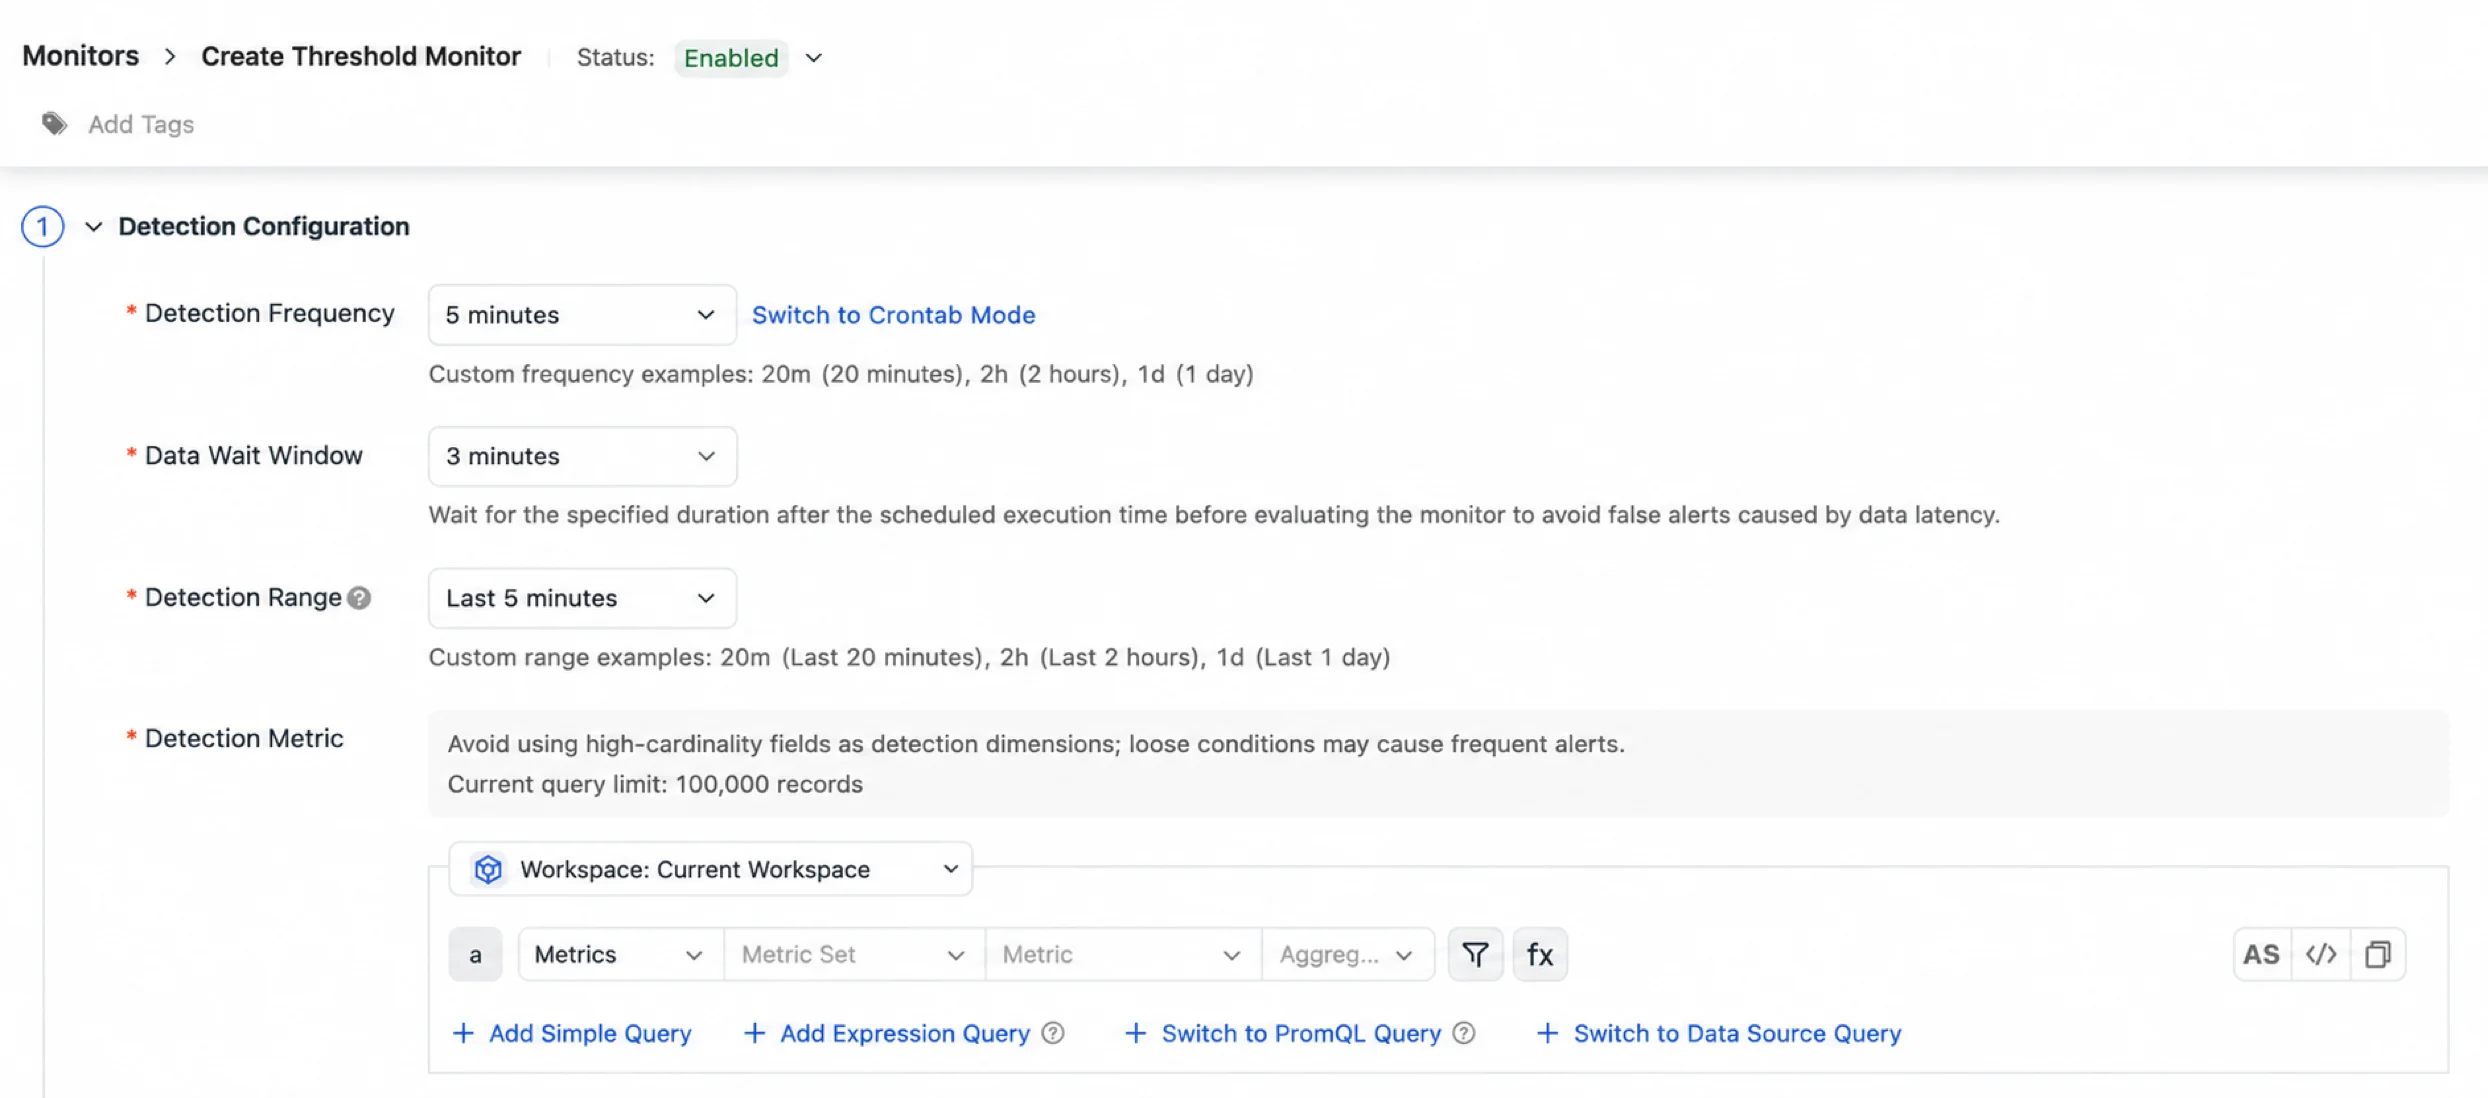
Data wait window
Monitors can now wait for a specified duration after the scheduled execution time before running, which accommodates delayed data reporting.
Cross-workspace alerting strategy search
Back-office management now supports searching monitor alerting strategies by member across workspaces, making it easier to review and maintain notification targets in one place.
Incident Center
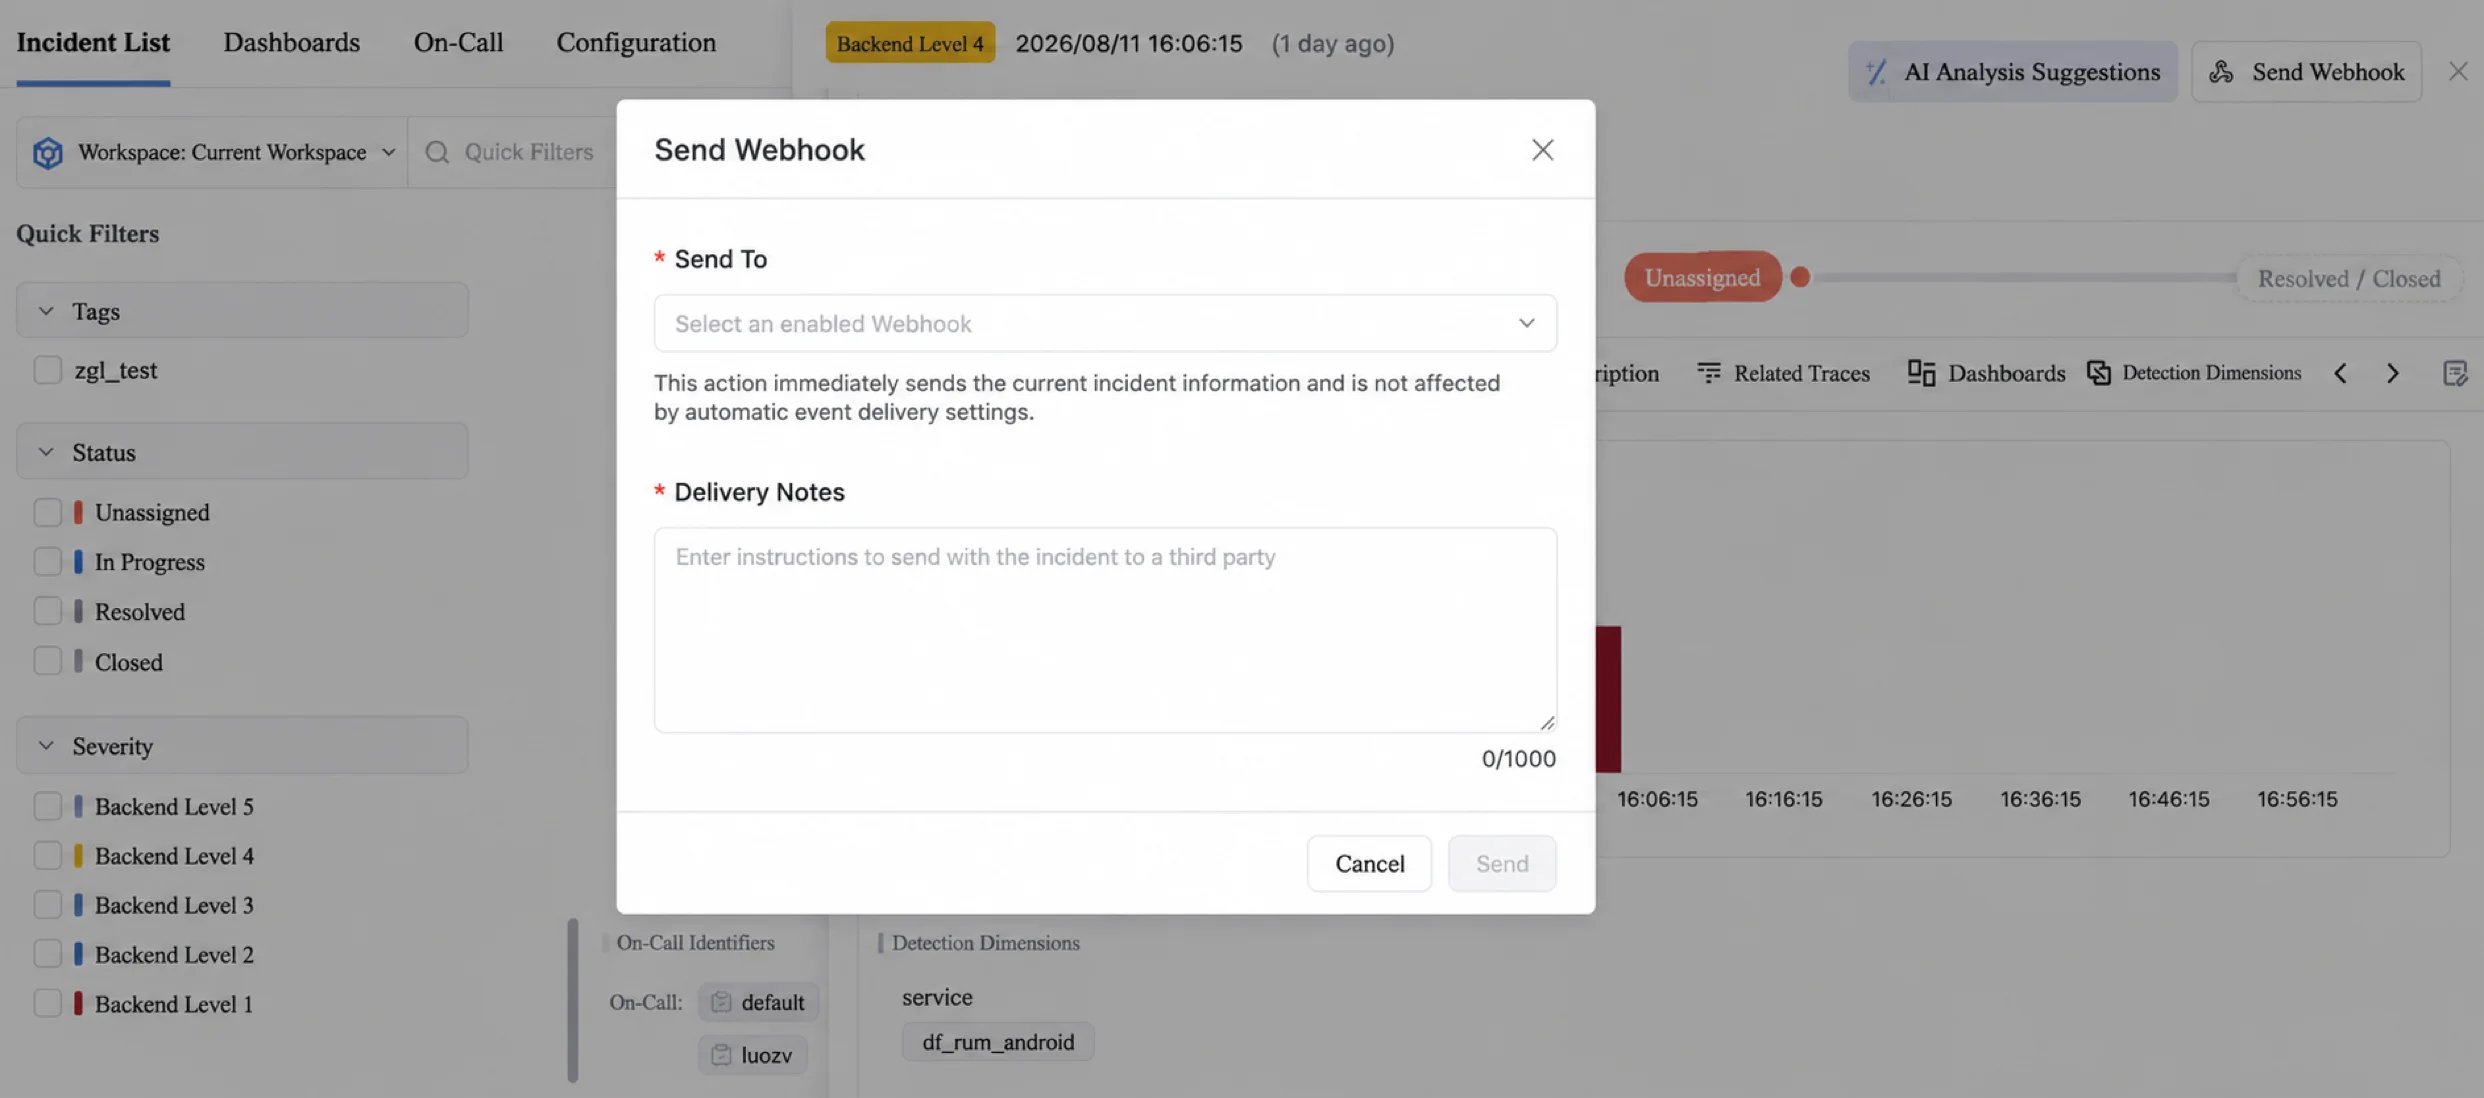
Manually triggered webhooks
The incident detail page now supports selecting a configured webhook channel and adding a note to send incident information to a third-party system. The trigger result is recorded on the incident activity timeline.
Scenes
Multi-user dashboard editing protection
Dashboards now show an editing prompt and conflict protection, reducing the risk of overwriting content when multiple users edit at the same time.
City-level GeoMap
Charts now support city-level GeoMap rendering for more granular geographic distribution.
Availability Monitoring
Asynchronous synthetic test task APIs
Synthetic test task APIs are now called asynchronously, improving API response efficiency and streamlining task execution.
Open API
SLS conversion support
Open API now supports SLS data migration scenarios.
DataKit
New features
- DBM statement metrics for MySQL, PostgreSQL, Oracle, and SQL Server add normalized SQL search and
normalized_query_hash, supporting cross-instance aggregation and correlation with statement metrics, SQL objects, activity samples, and execution plans. - DataWay data reporting adds Protobuf + zstd compression support.
- The synthetic test debugging API supports asynchronous execution, with queuing, concurrency control, status queries, and result retention.
- Field generation functions in Pipeline support a custom field name prefix.
- A new W32Time collector gathers Windows Time service status, clock offset, NTP round-trip delay, and the number of available time sources.
- Log collection adds a
json_as_fieldsmode that converts the top-level properties of a JSON object into log fields. - Browser synthetic tests add Actions, and assertion Actions gain polling support.
Improvements
logfwdno longer adds afilenamefield by default, avoiding invalid file names on forwarded logs.- DCA is upgraded to 0.1.8, improving DataKit list search debouncing and the lifecycle of WebSocket connections and listeners.
Bug Fixes
- Fixed an issue where the field count on the log export page was displayed incorrectly.
- Fixed an issue where data could not be queried after connecting a Prometheus data source through Func.
- Fixed an issue where screenshots in scheduled report email attachments were blank.
- Fixed an issue where the service count in the application service topology was inaccurate after filtering by environment.
- Fixed an issue where international phone alerts did not work in managed-deployment environments.
- Fixed an issue where Func API calls still returned an error for local users with the Owner role.
- Fixed an issue where results did not match expectations after navigating from a monitor event to View All Logs.
- Fixed an issue where log DQL queries returned incorrect results when using
BYgrouping. - Fixed an issue where selecting a one-day time range on a dashboard produced an abnormal aggregation granularity, causing inconsistent data point counts before and after zooming.
FAQ
What is the biggest operational update in this release?
The daily metric data point cap, per-index log display settings, and cross-instance database query analysis give teams the most direct control over cost, log readability, and slow query investigation.
What changed for Toby AI TruePilot and Toby AI Agents?
Toby AI TruePilot can now run at a selected model tier to balance quality, speed, and credit usage, while Toby AI Agents gains form or JSON MCP configuration, knowledge base references in tasks, instant event forwarding to IM groups, and editable session aliases.
Why does this release matter for observability teams?
It reduces friction in daily workflows: capping runaway metric ingestion, exporting full log datasets without sampling, archiving to Apache Iceberg for external query engines, triggering webhooks from an incident, and collecting richer DBM and Windows time data with DataKit.
