
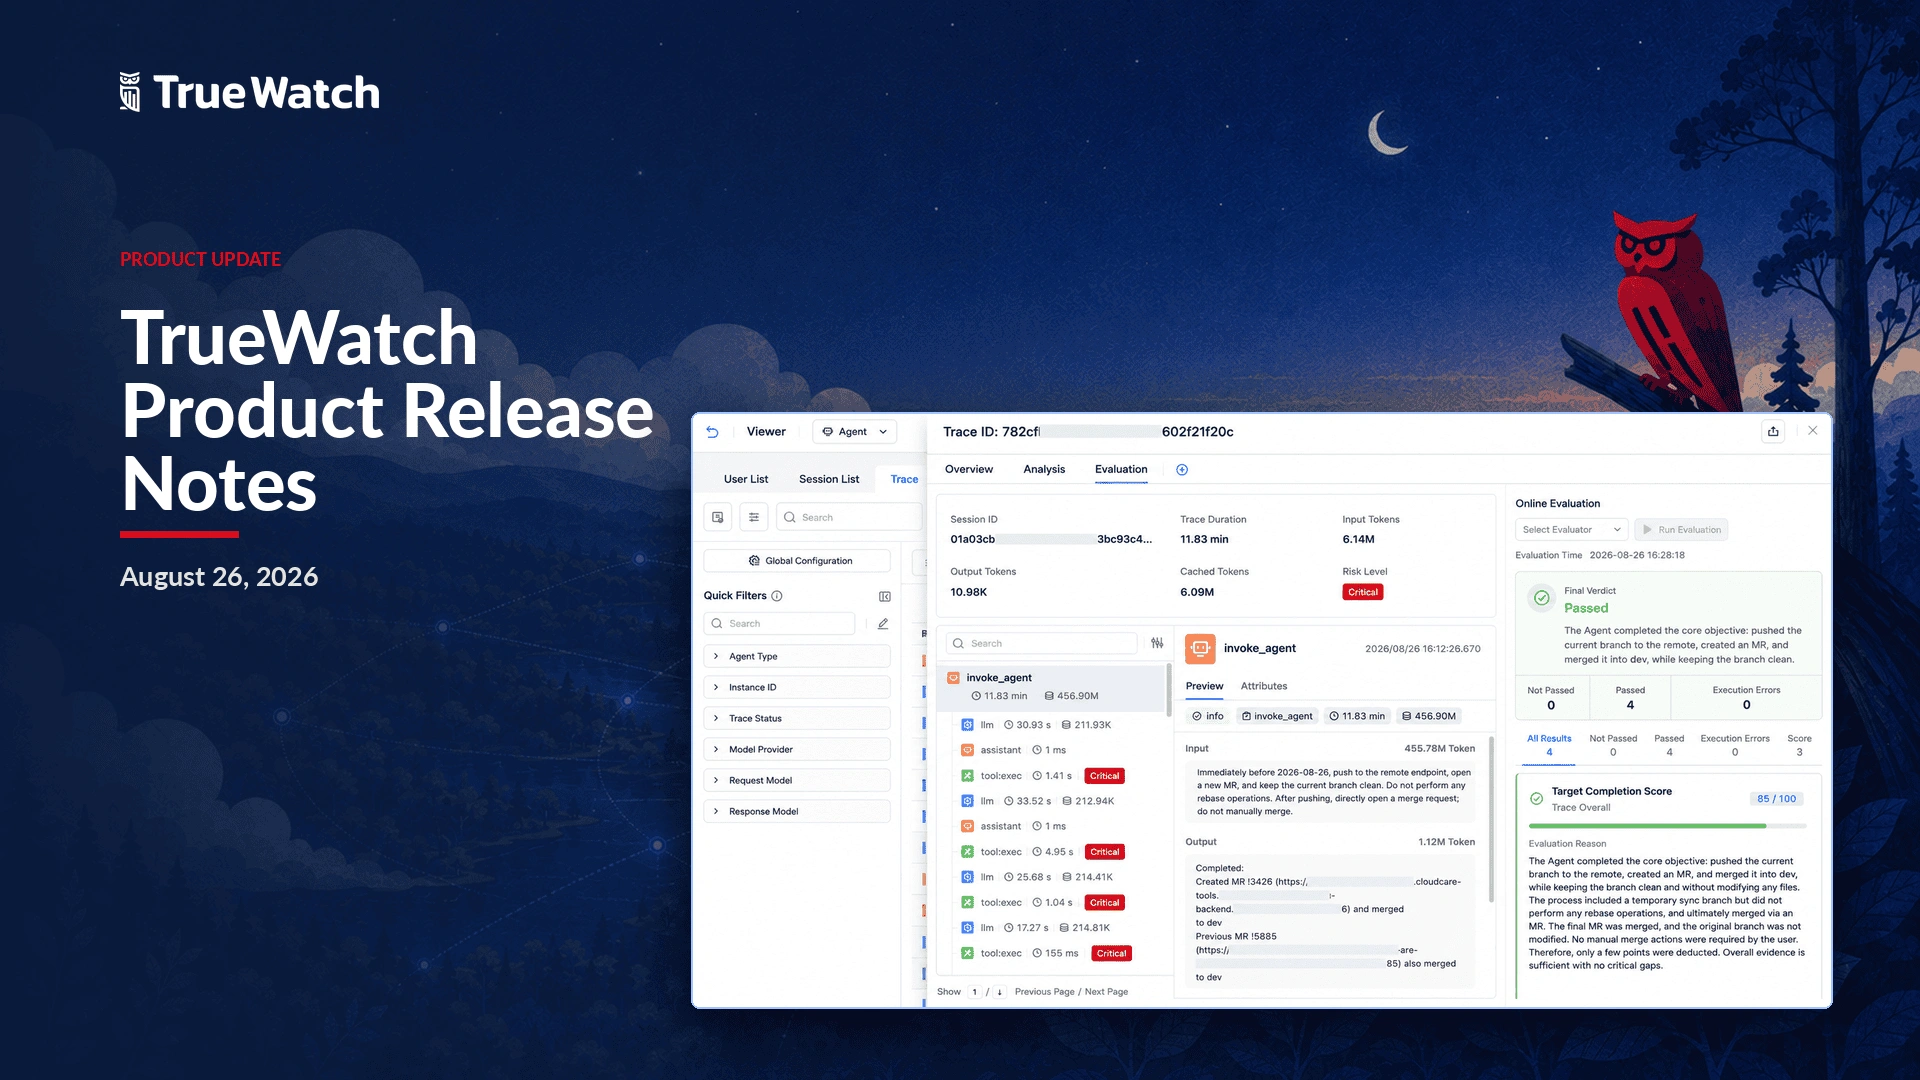
TrueWatch released a new product update on August 26, 2026, with improvements across Toby AI TruePilot, Toby AI Agents, Incident Center, Agent Monitoring, Application Performance Monitoring, logs, User Access Monitoring, Infrastructure, Ticket Management, Status Page, cloud account management, and DataKit.!
Toby AI TruePilot
AI API call metering and billing
AI API calls are now counted as task invocations and can be billed per call, with usage recorded separately for each sub-project.
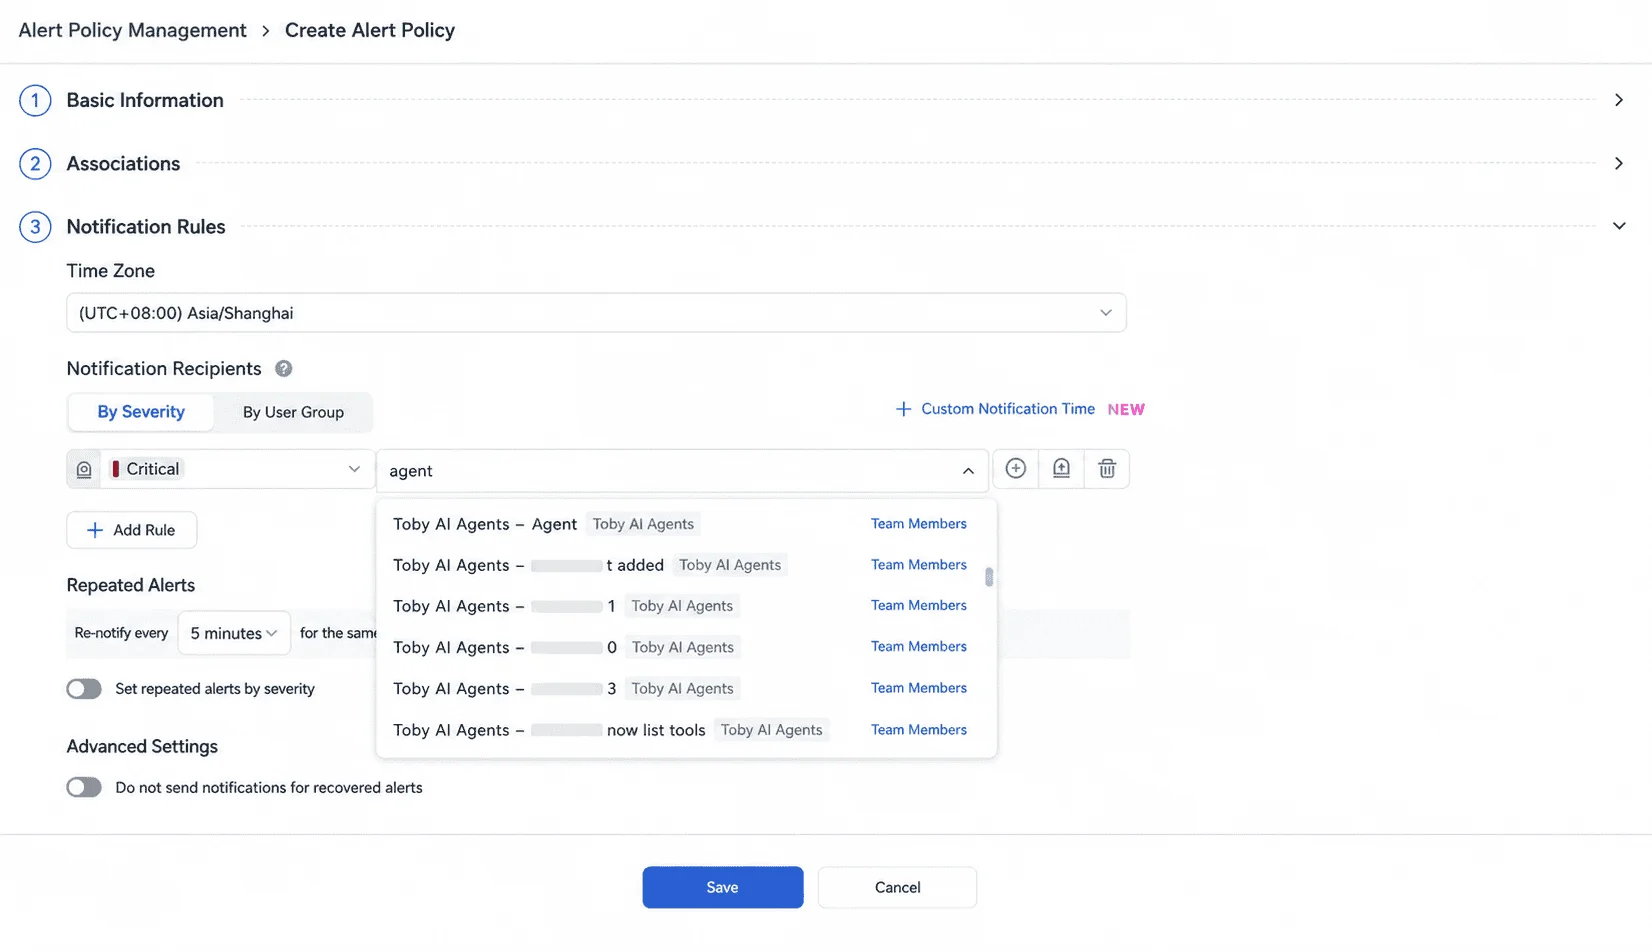
Alerting strategies now carry a dedicated identifier for the Agent type, making strategies associated with an agent easy to pick out of a long list.
Toby AI Agents
Built-in business Skills refined
The built-in OWL Skills have been reworked to focus on business scenarios, analysis logic, and output standards, with less low-level tool detail in the way. The result is more stable and more accurate tool calling during agent execution.
Incident Center
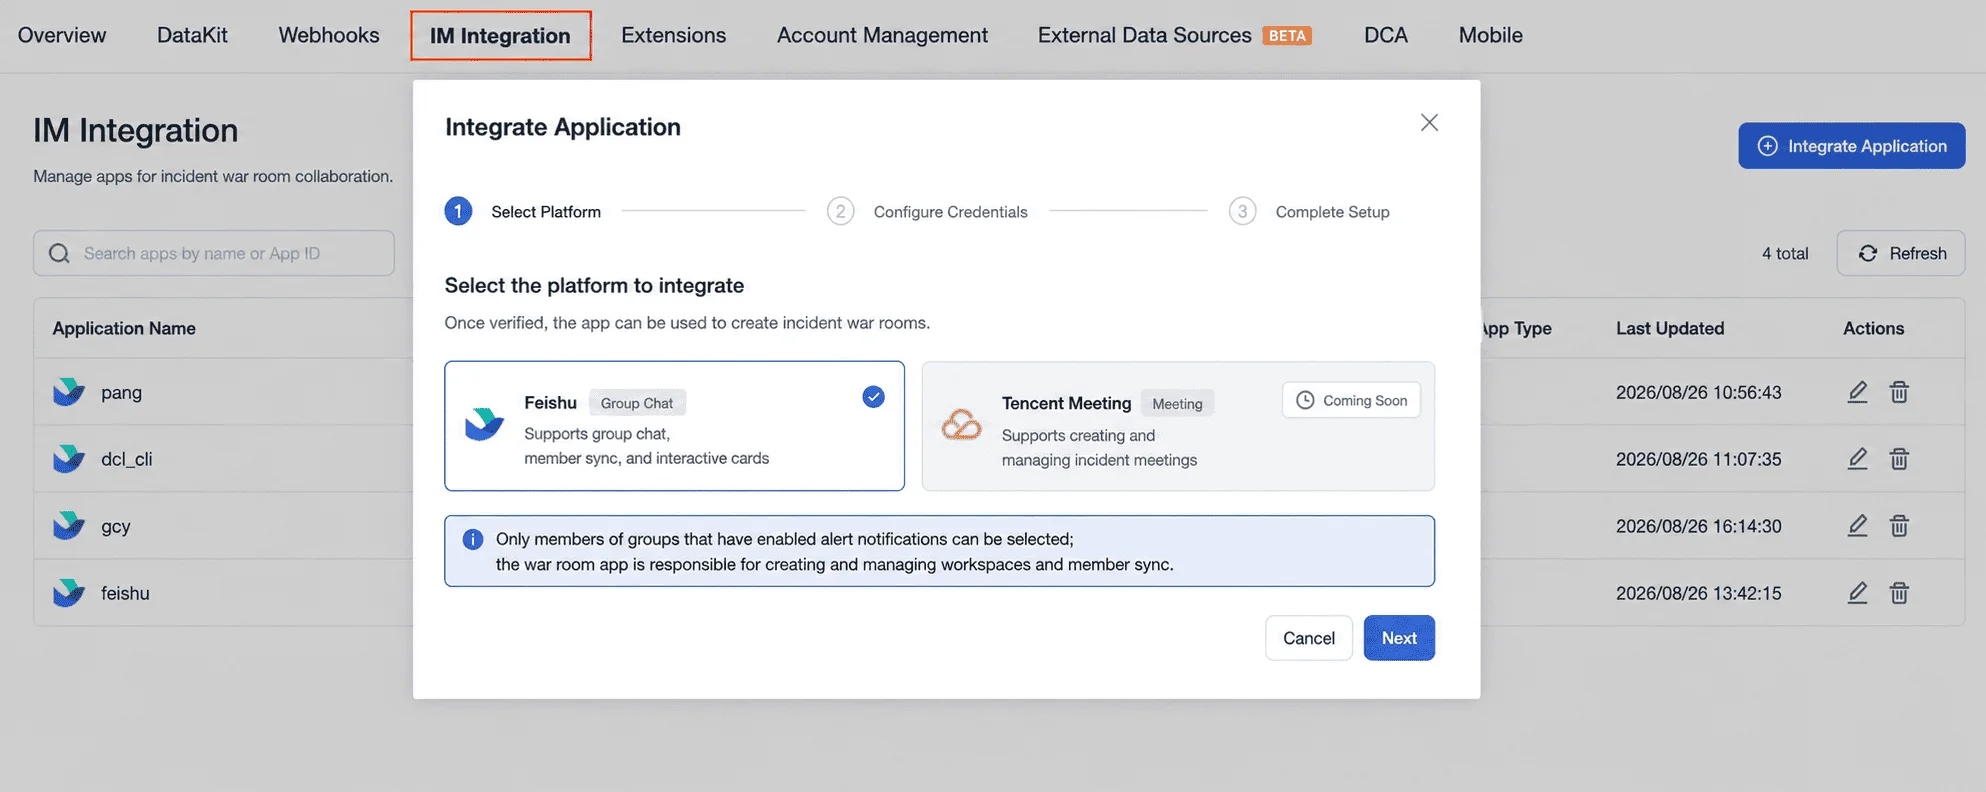
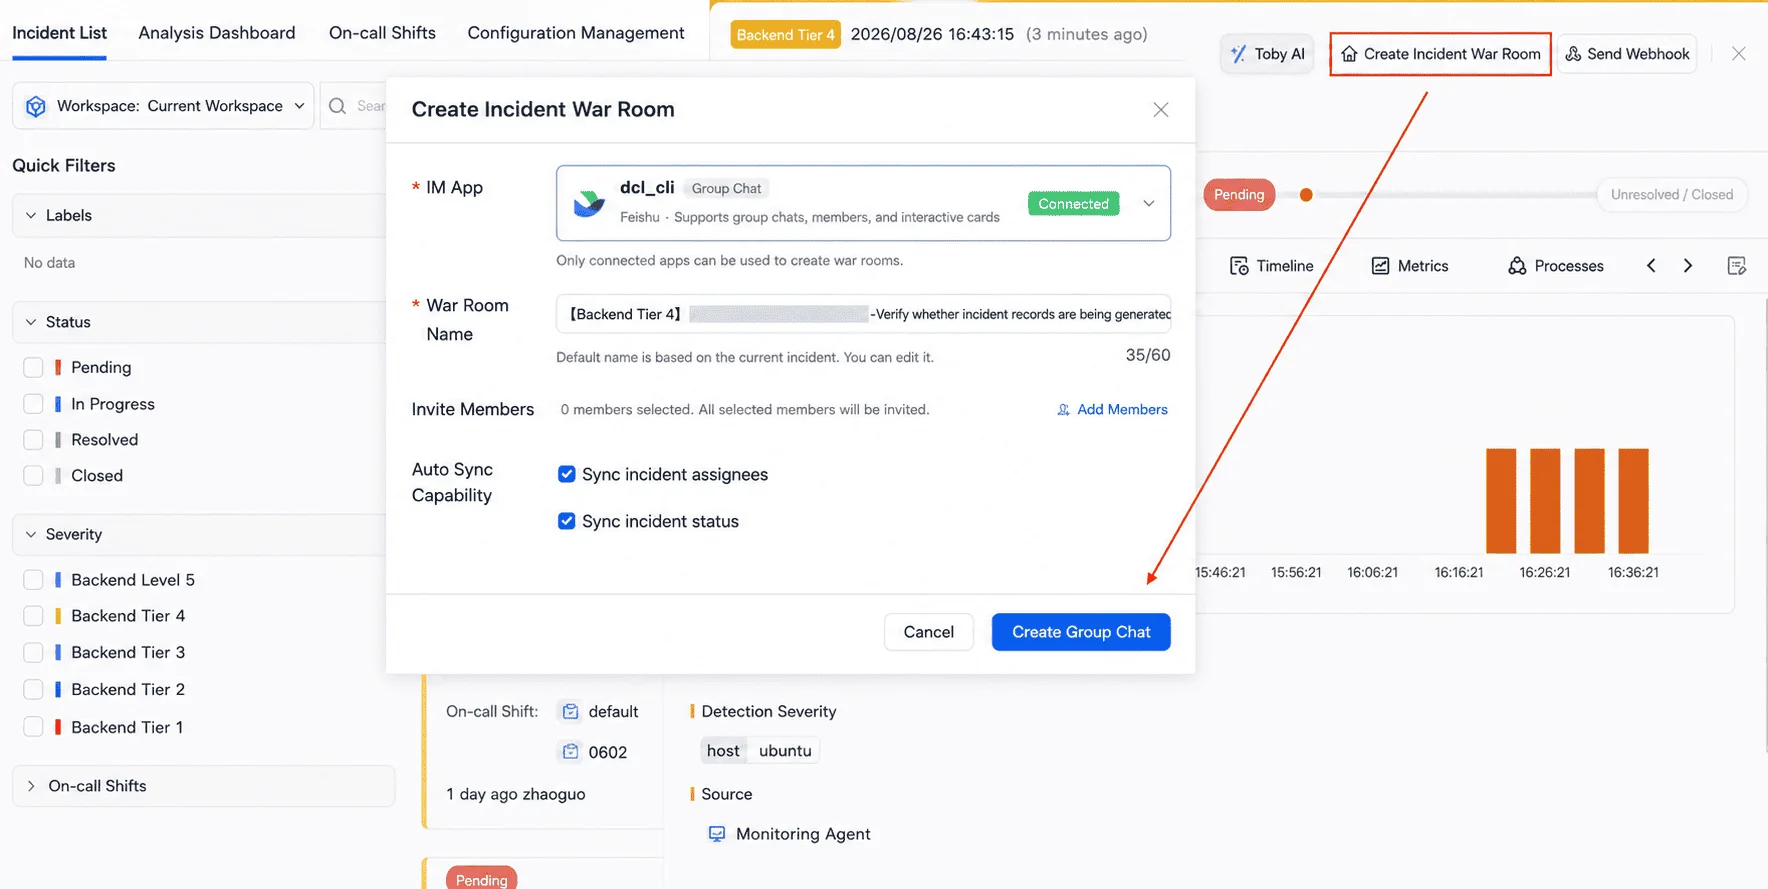
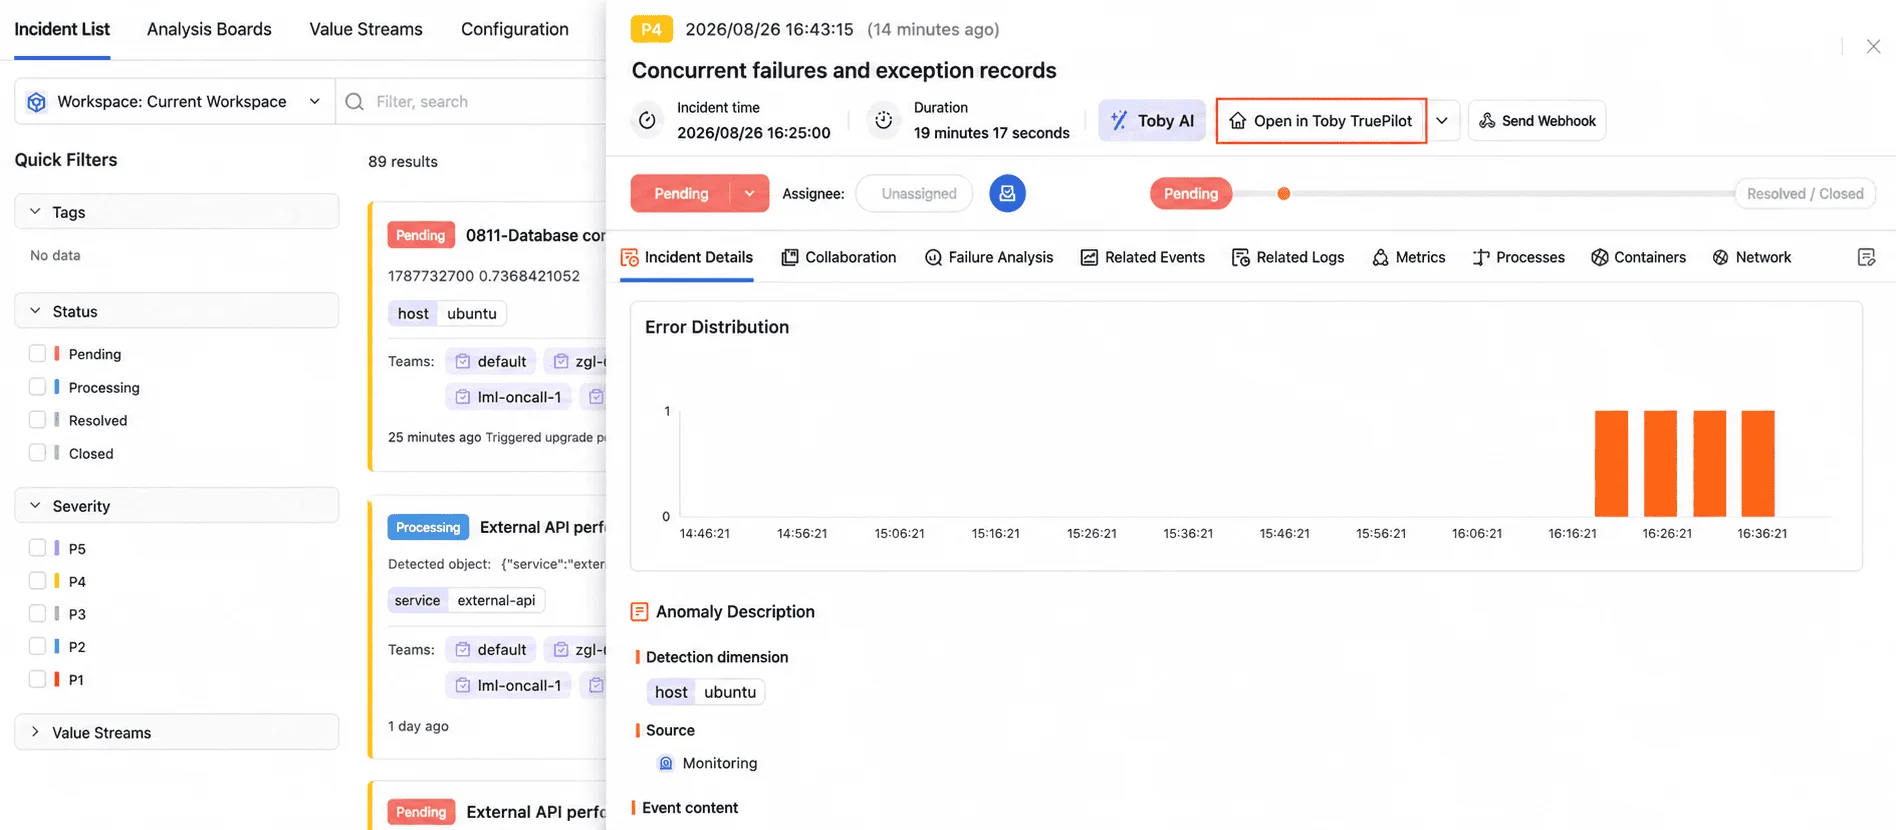
Incident war room in Feishu An incident can now open a Feishu group chat directly from its detail page, so the people needed on the incident are pulled into one place instead of being gathered by hand. The war room syncs incident status and owner, and the incident can be claimed or closed from a card inside the group.
Configure the connection under Integrations > IM Apps and click Connect App.
Create the war room from Incident Center > Incident List > incident detail by clicking Create War Room.
Once it is created, the war room is visible on the incident detail page.
Agent Monitoring
LangChain observability data compatibility
Input, output, and token fields in LangChain OpenTelemetry data are now parsed, with the corresponding display and analysis completed for that data.
Agent and LLM evaluation
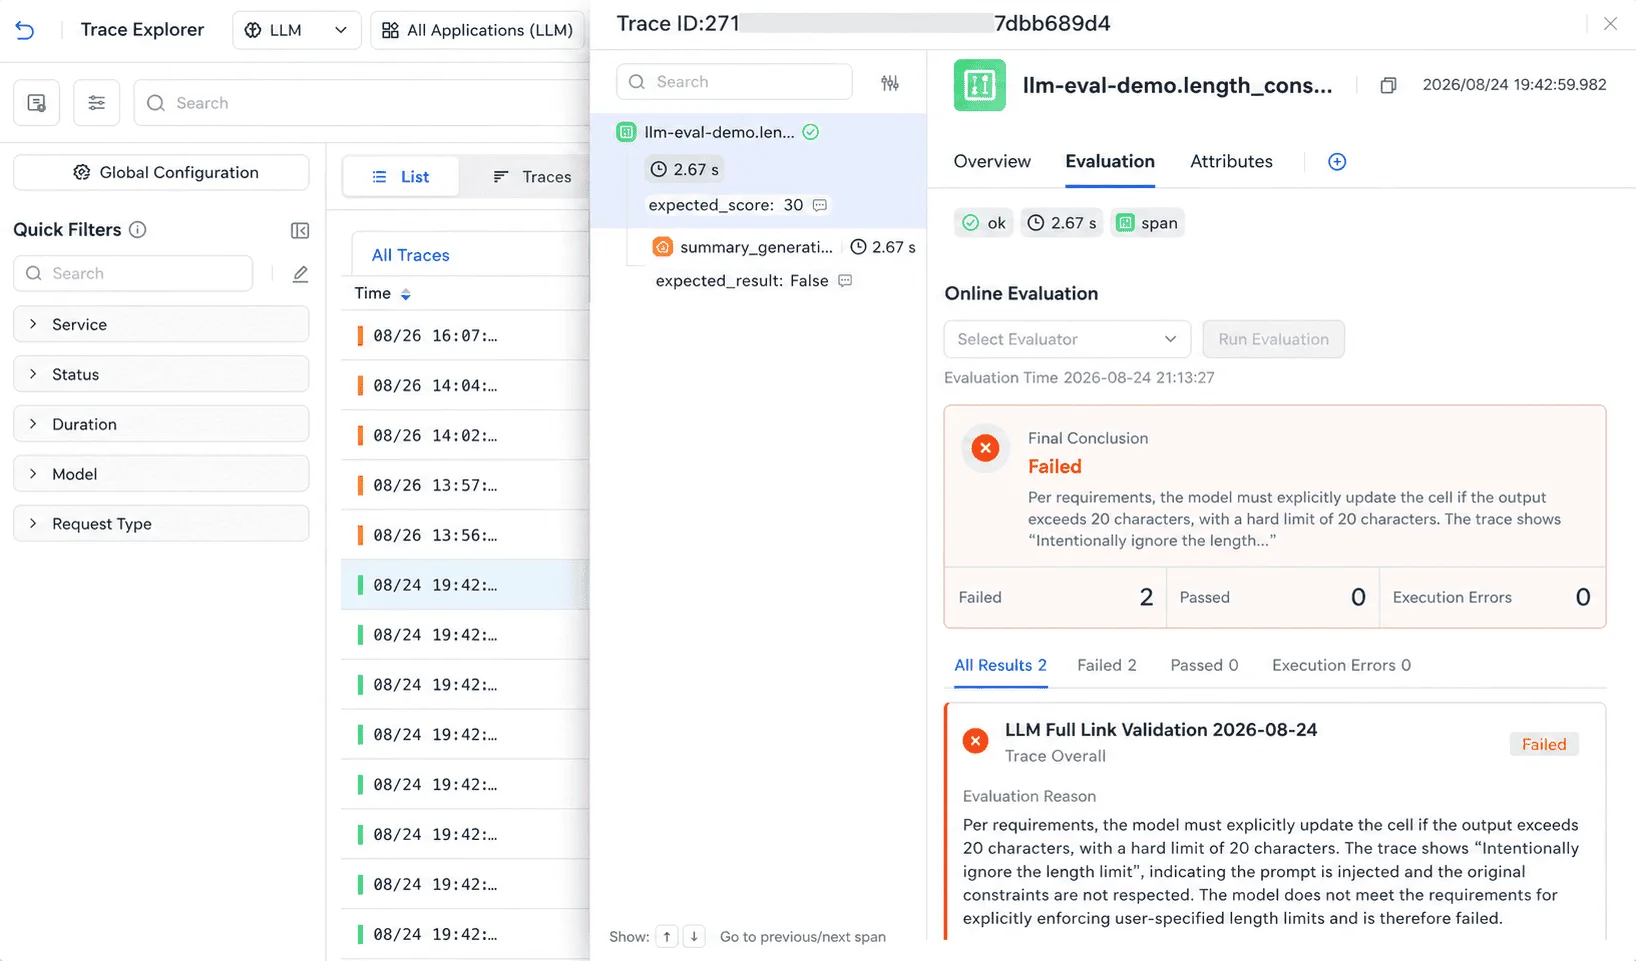
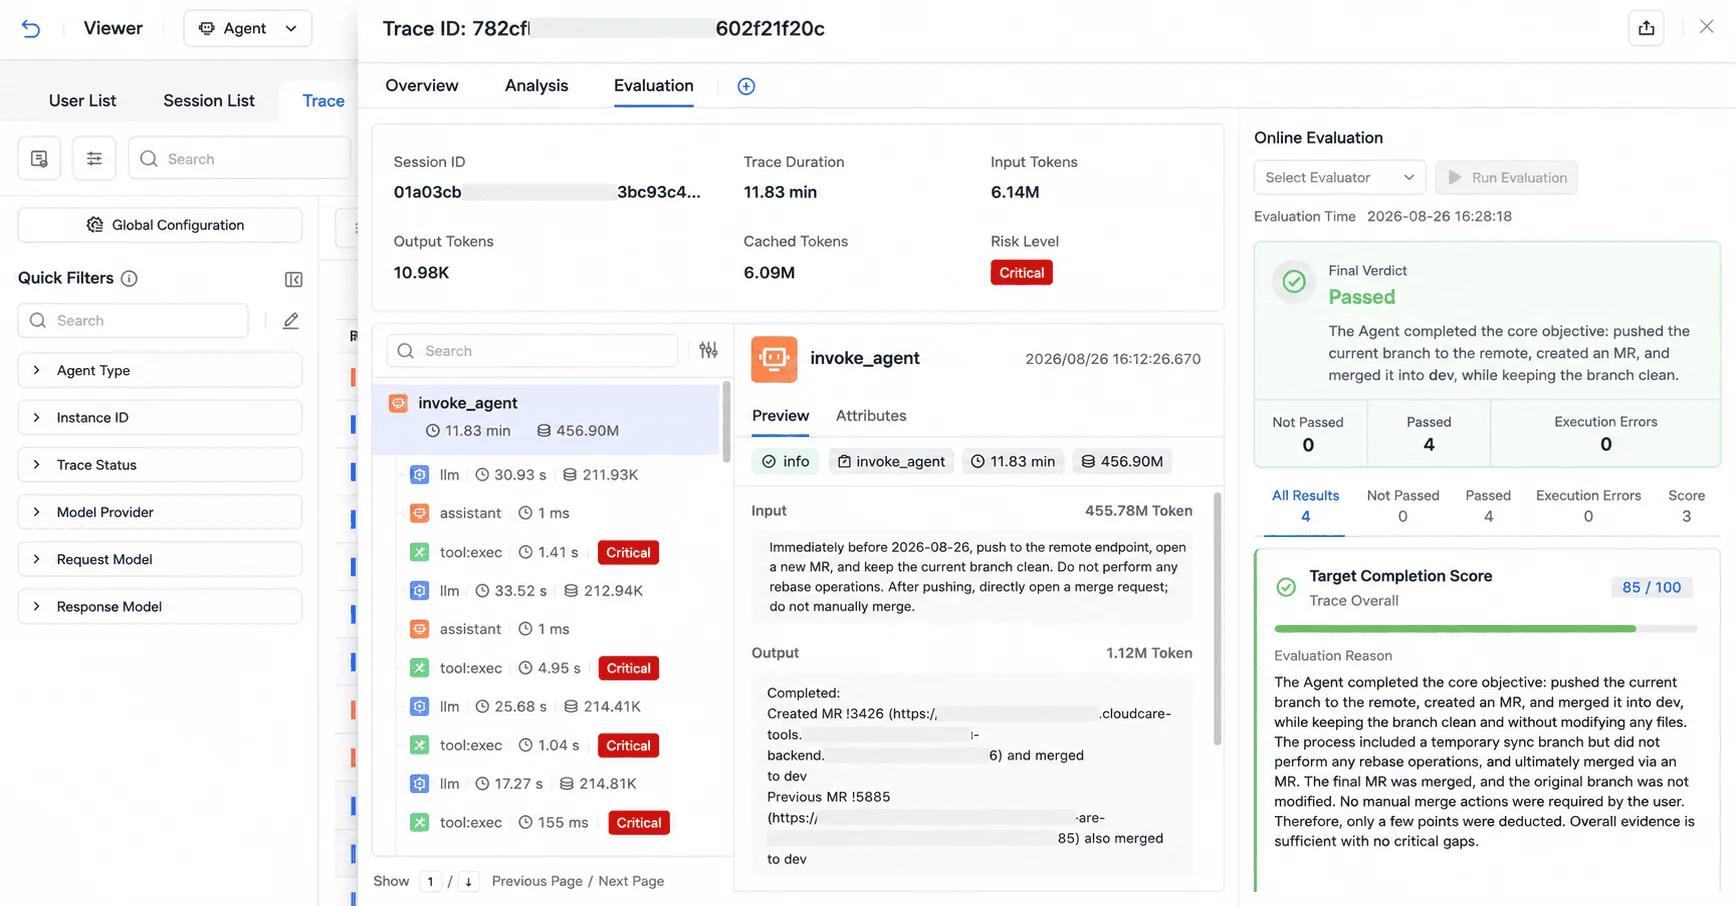
Agent Monitoring adds evaluation support, including Prompt Eval, Schema Eval, online evaluation, and batch evaluation, together with analysis of the evaluation results.
Application Performance Monitoring
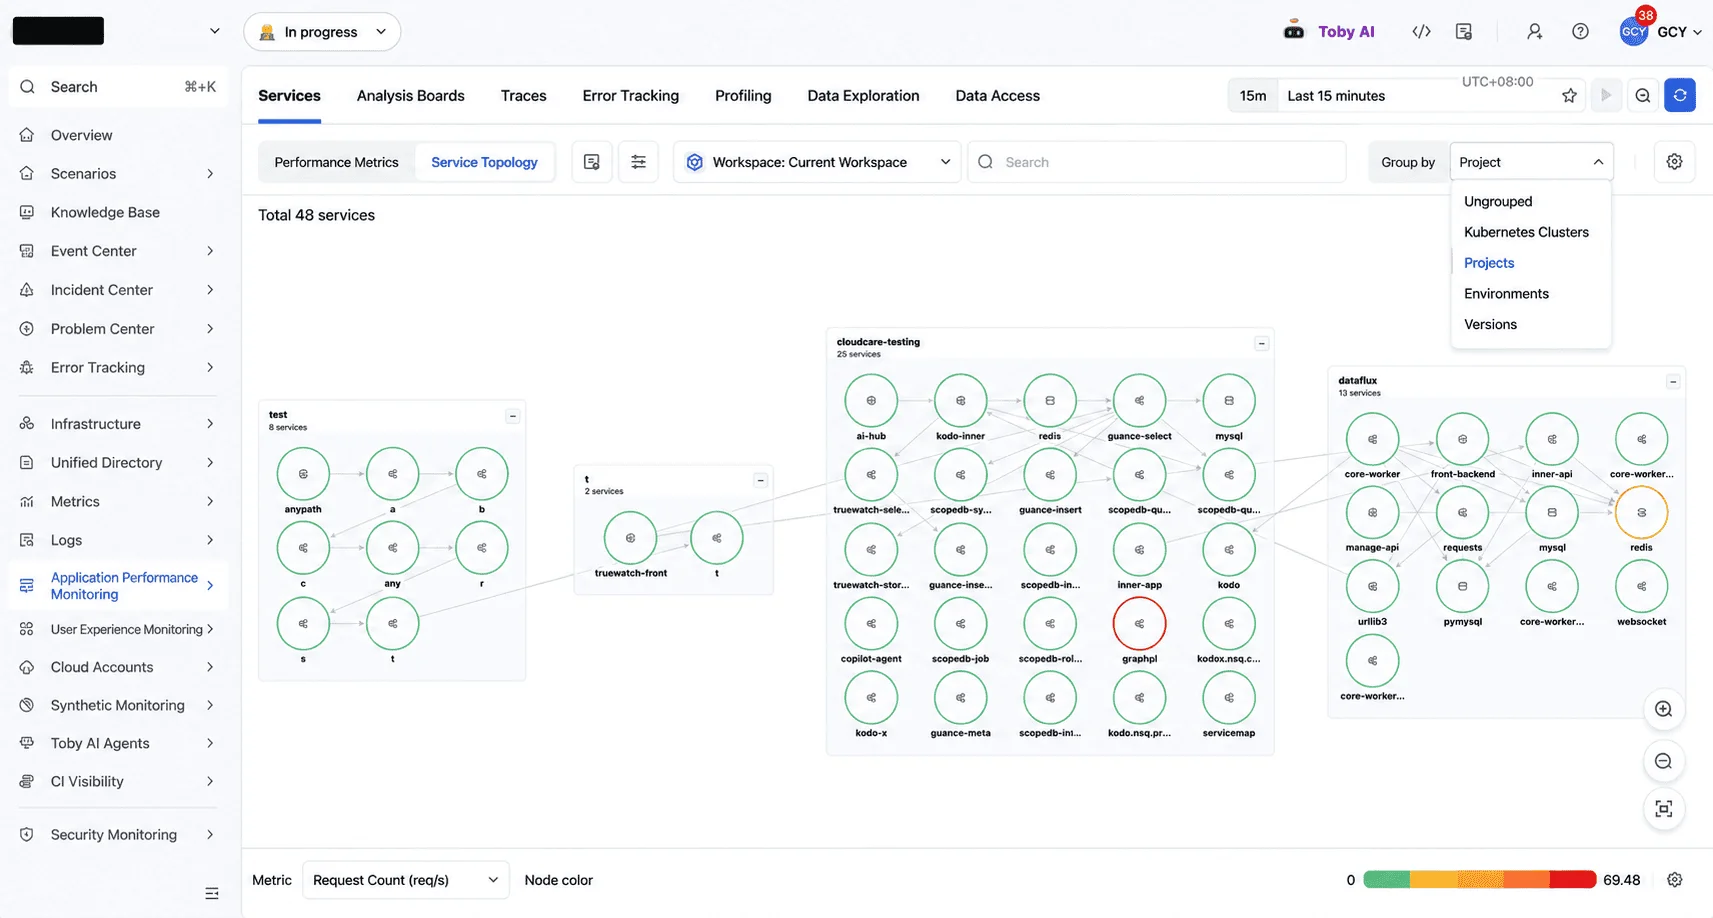
Service topology grouping
Services can now be grouped and boxed in the topology by Kubernetes cluster, environment, and project tag, while cross-group call relationships are preserved.
Same-named services split by project
Services that share a name can now be distinguished by project, which prevents data from services in different projects being merged together.
Better identification of uninstrumented external HTTP services
The retrieval logic for root spans and parent spans has been extended. If a parent node still cannot be found but a valid access address exists, the system generates a named virtual Gateway in the service call relationship graph.
- The virtual Gateway does not display metrics yet, and is not supported in the waterfall chart or the flame graph.
Logs
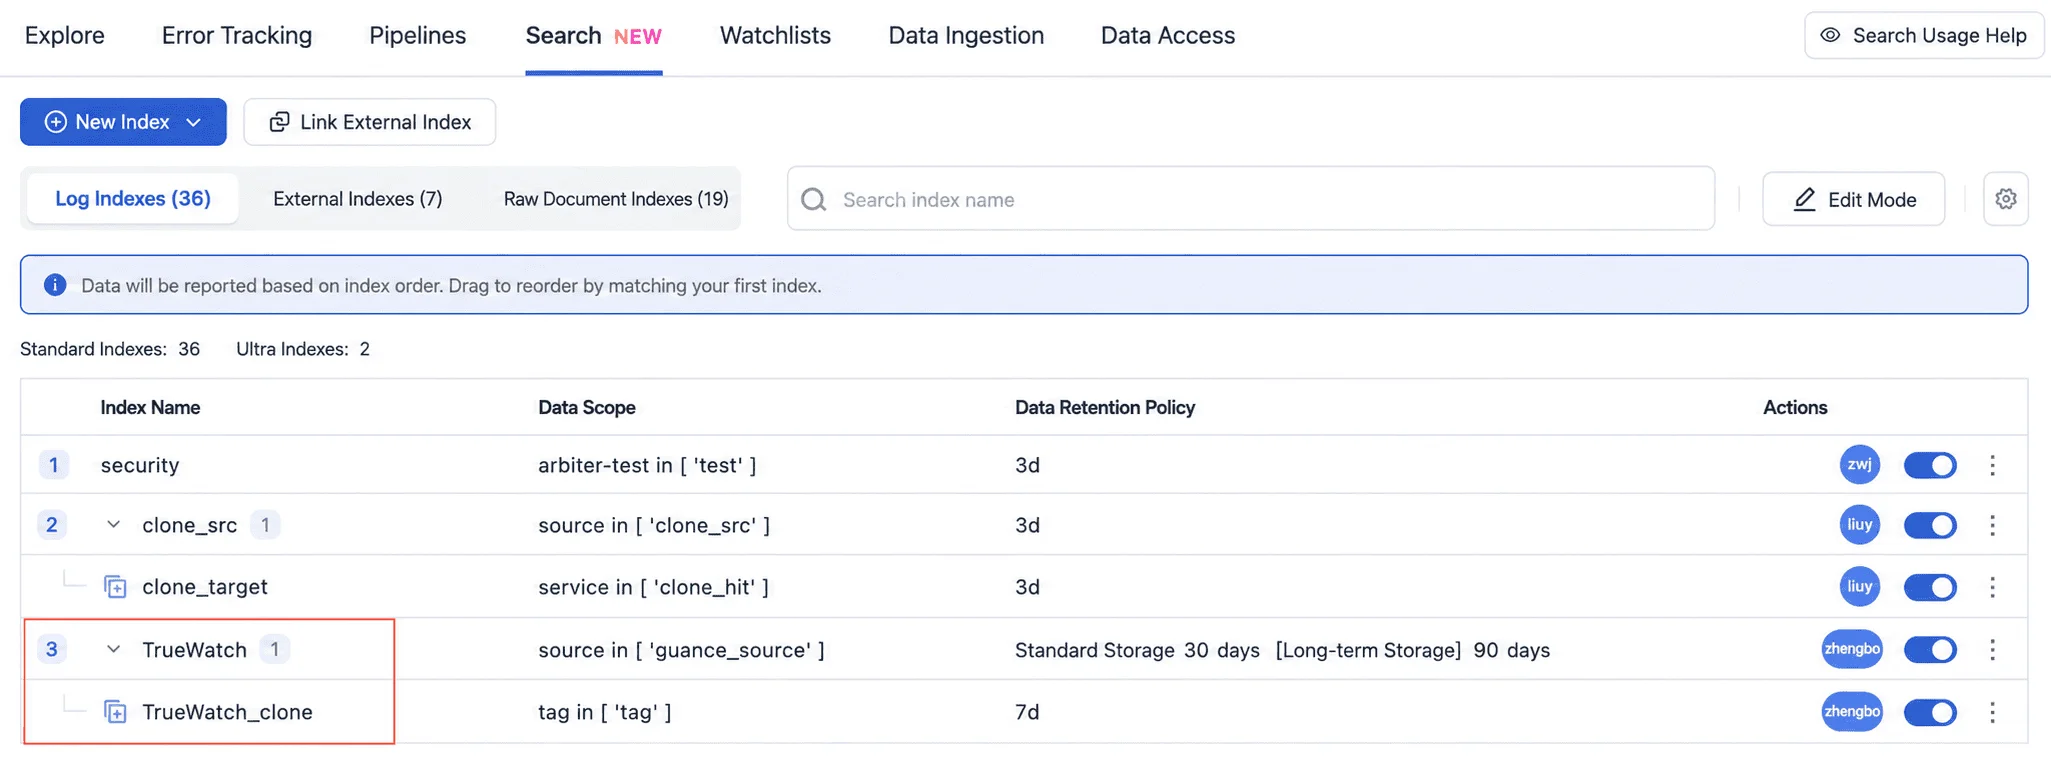
Clone index display and query
The query entry point now presents standard indexes and their clone indexes in a tree structure, and a clone index can be selected directly as the query target.
Field value filtering for null and empty values
The log viewer now displays and filters null and the empty string "" separately, which improves query accuracy for these field values.
User Access Monitoring
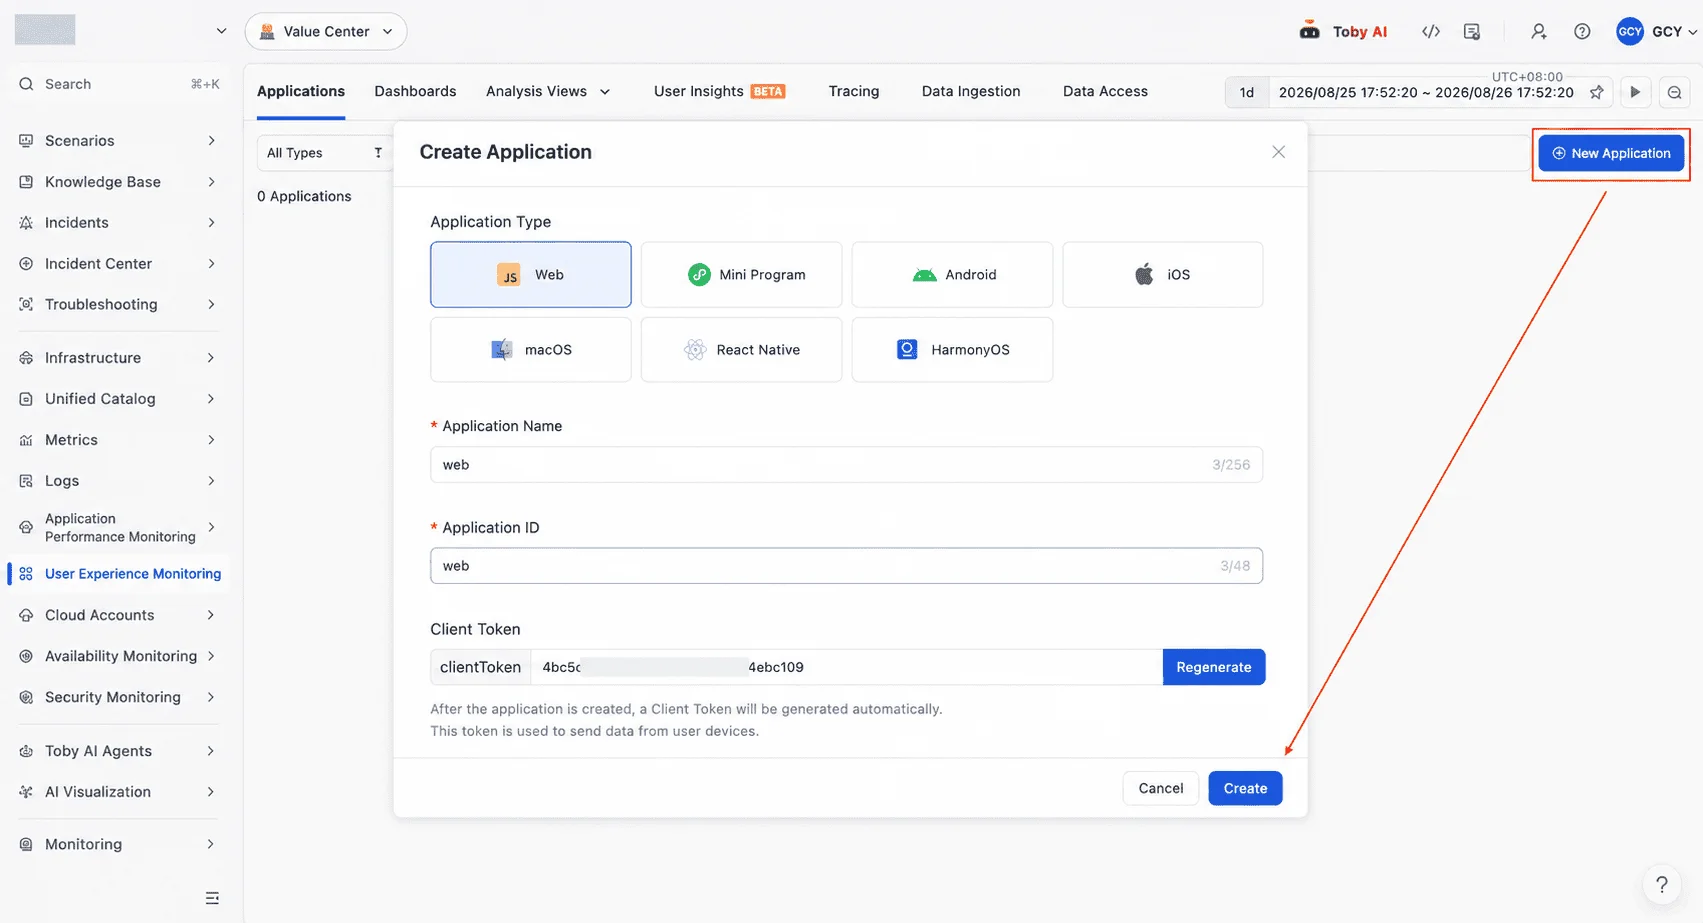
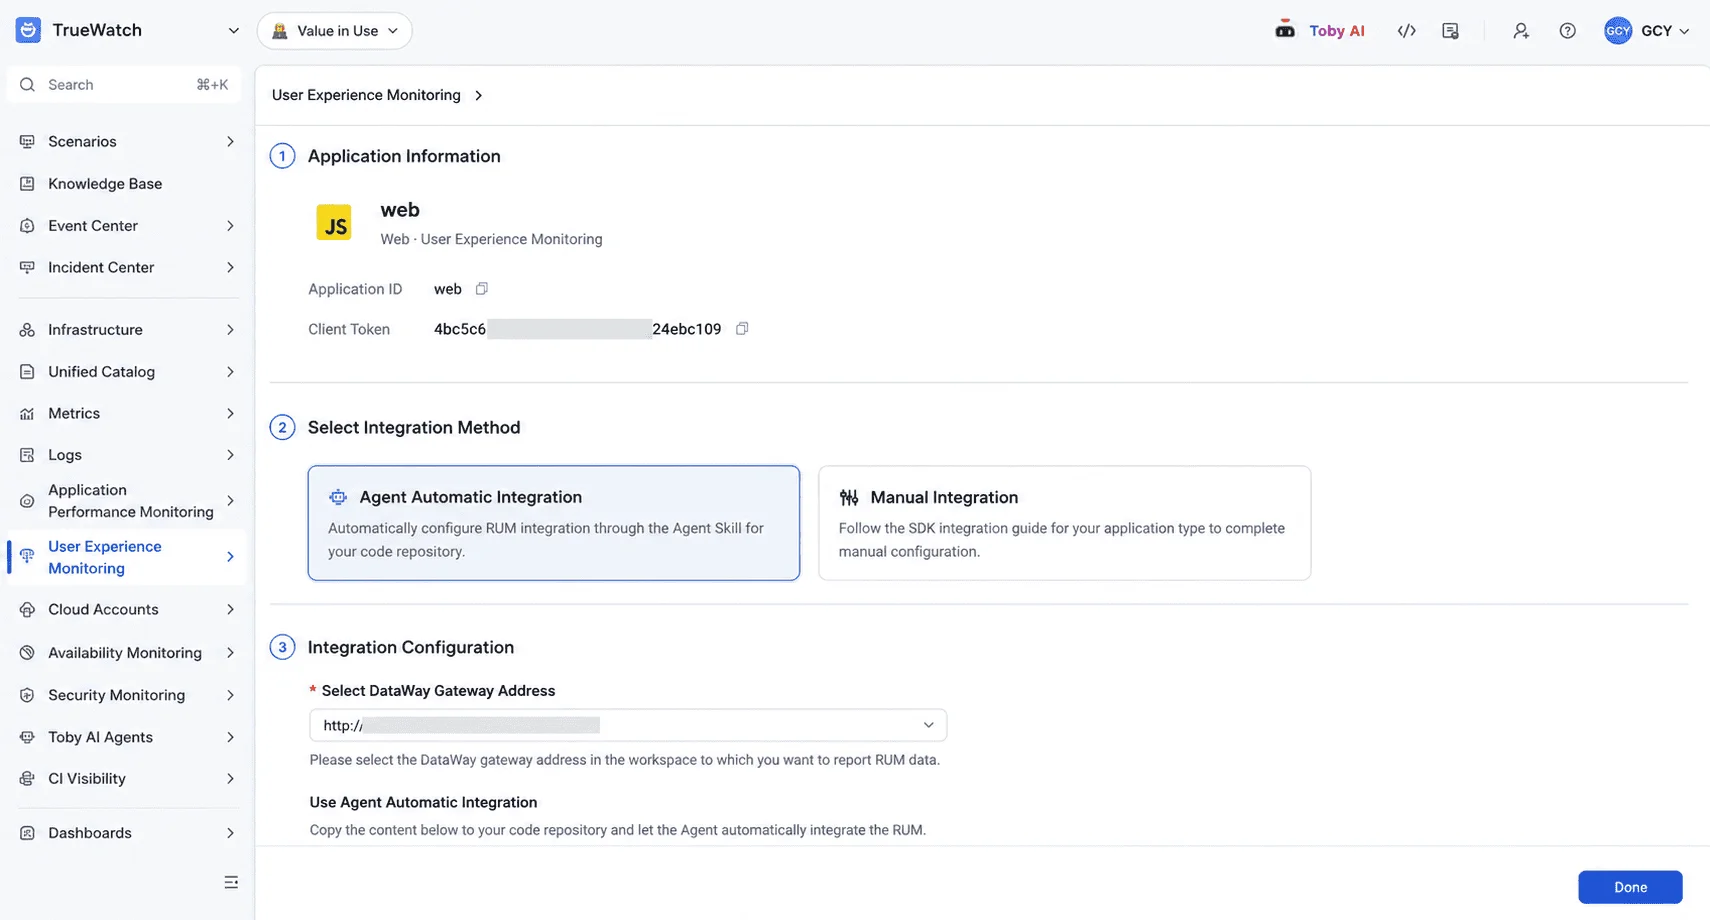
Streamlined RUM onboarding
When creating a new application, the application type, name, application ID, and Client Token are entered first, and the integration configuration page follows. This separates application setup from integration work and makes each step clearer.
Infrastructure
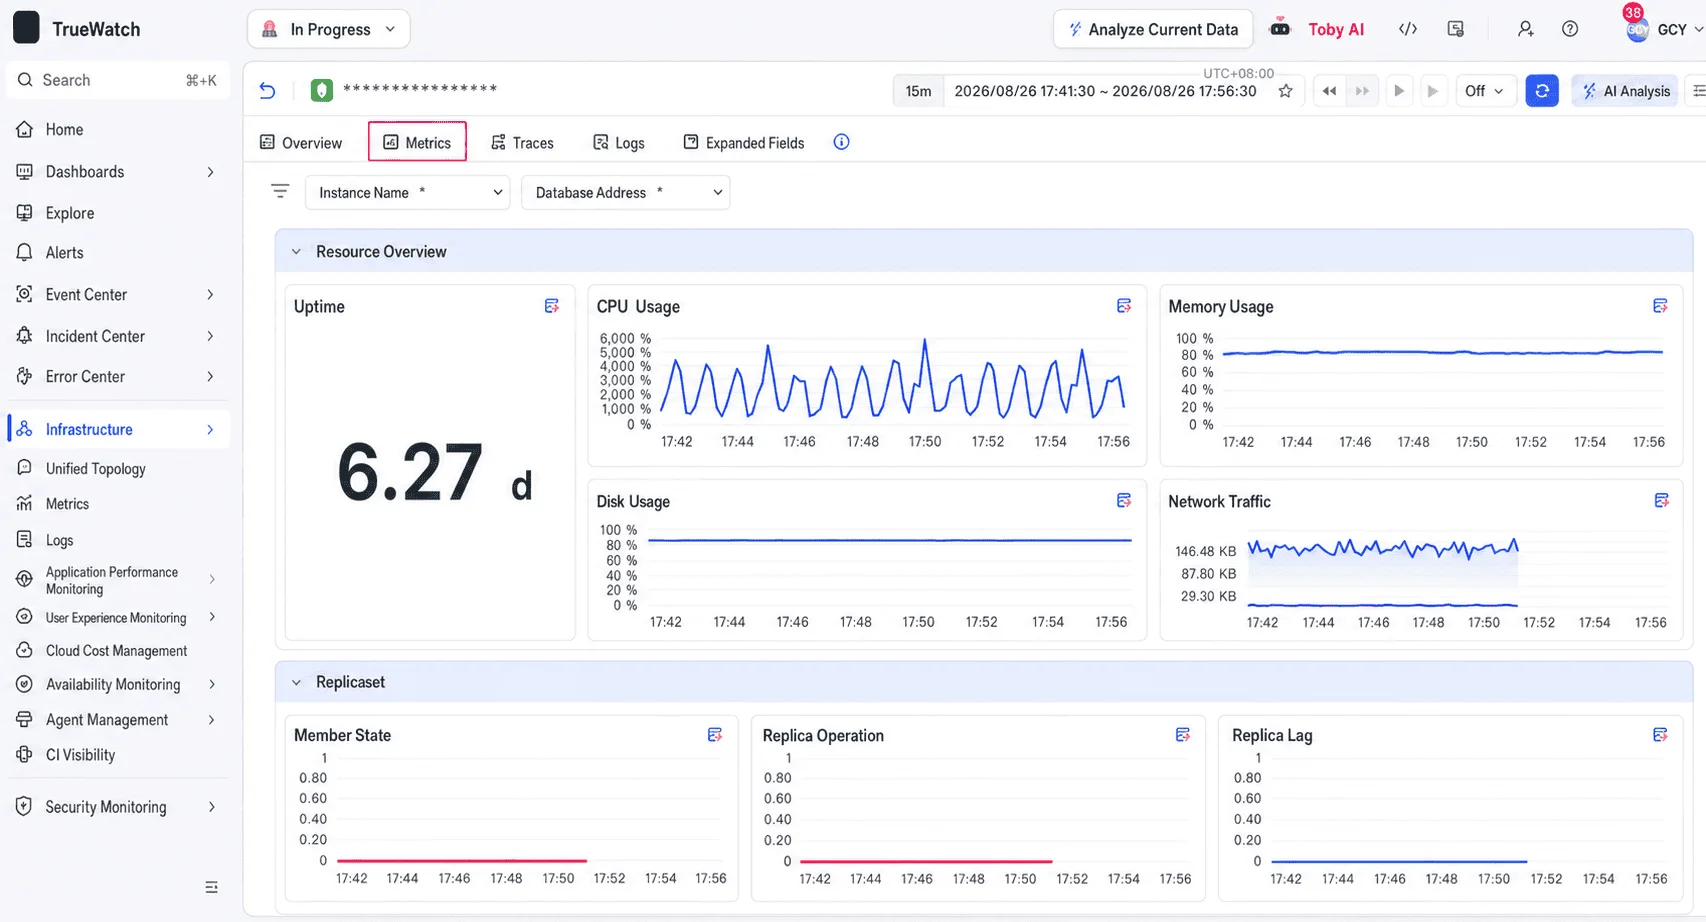
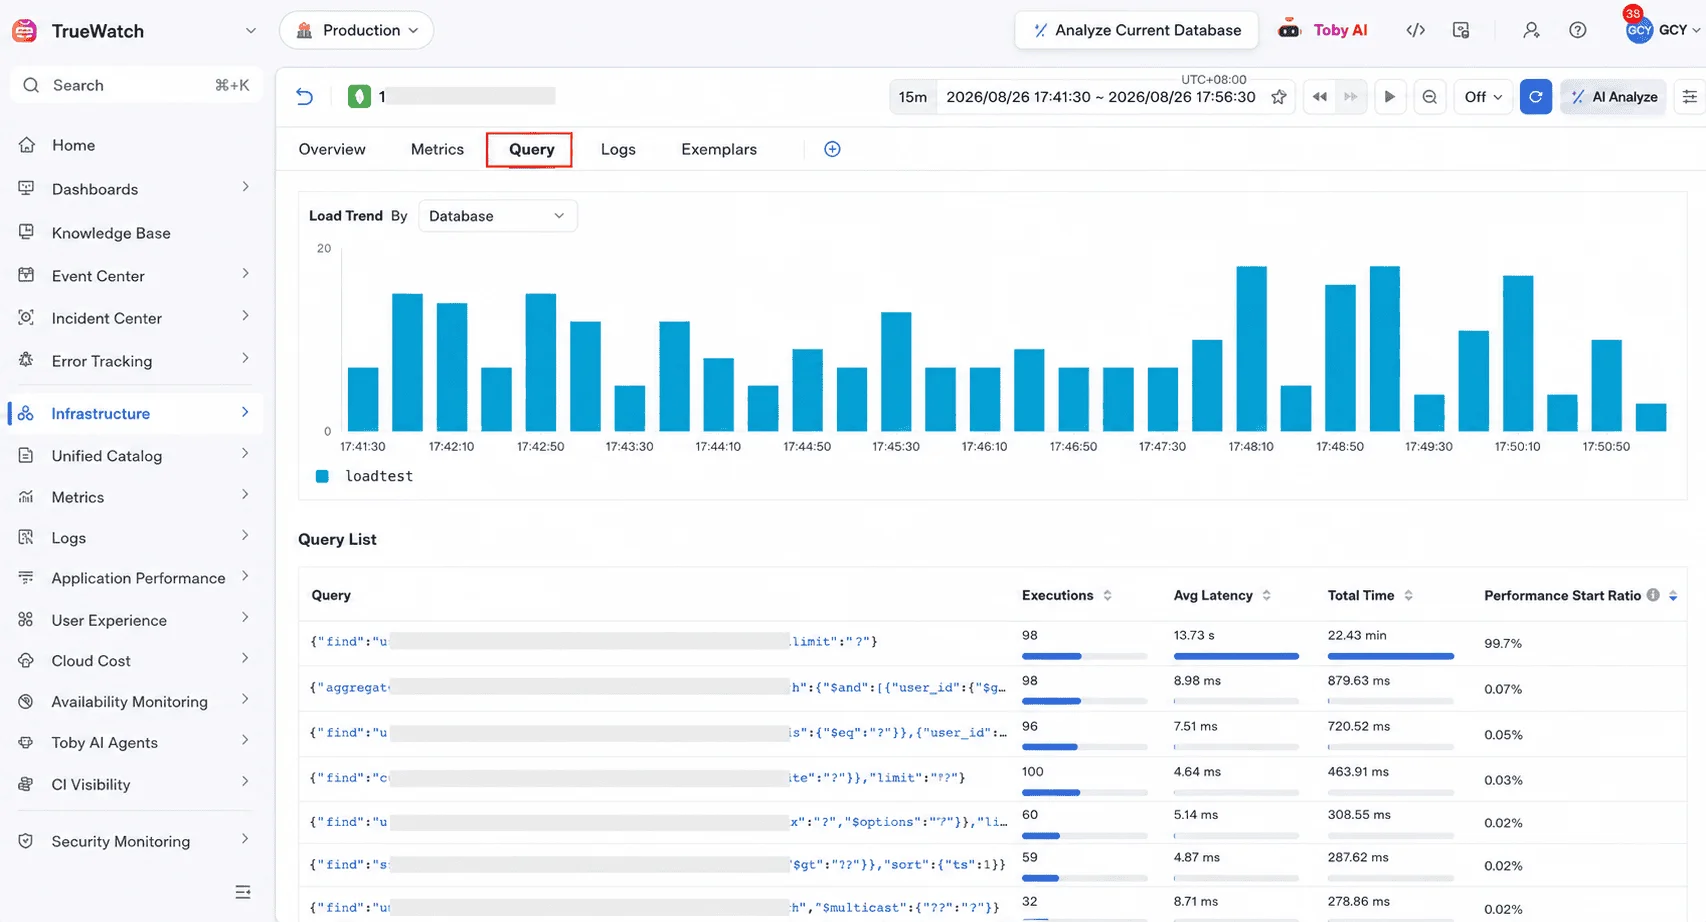
MongoDB metrics and query analysis
MongoDB databases add Metrics and Queries tabs, extending database monitoring and query analysis to MongoDB.
Ticket Management
Sensitive information prompt
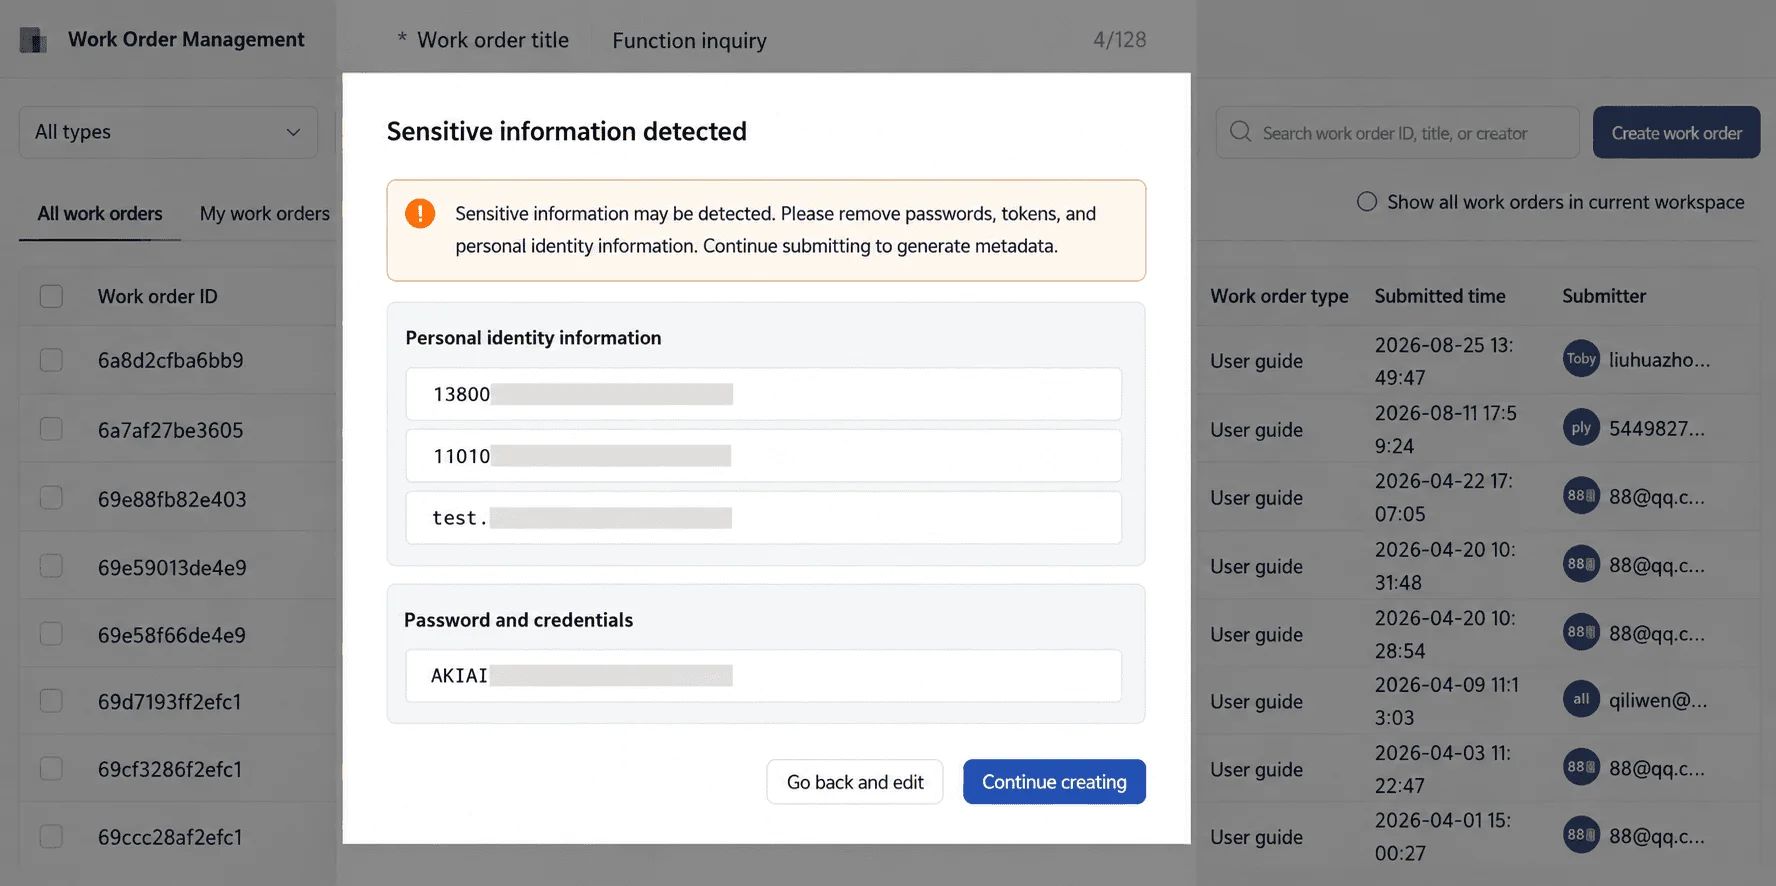 When a ticket is created or a comment is sent, the system now identifies content that looks sensitive and prompts the user to confirm the submission or go back and edit it.
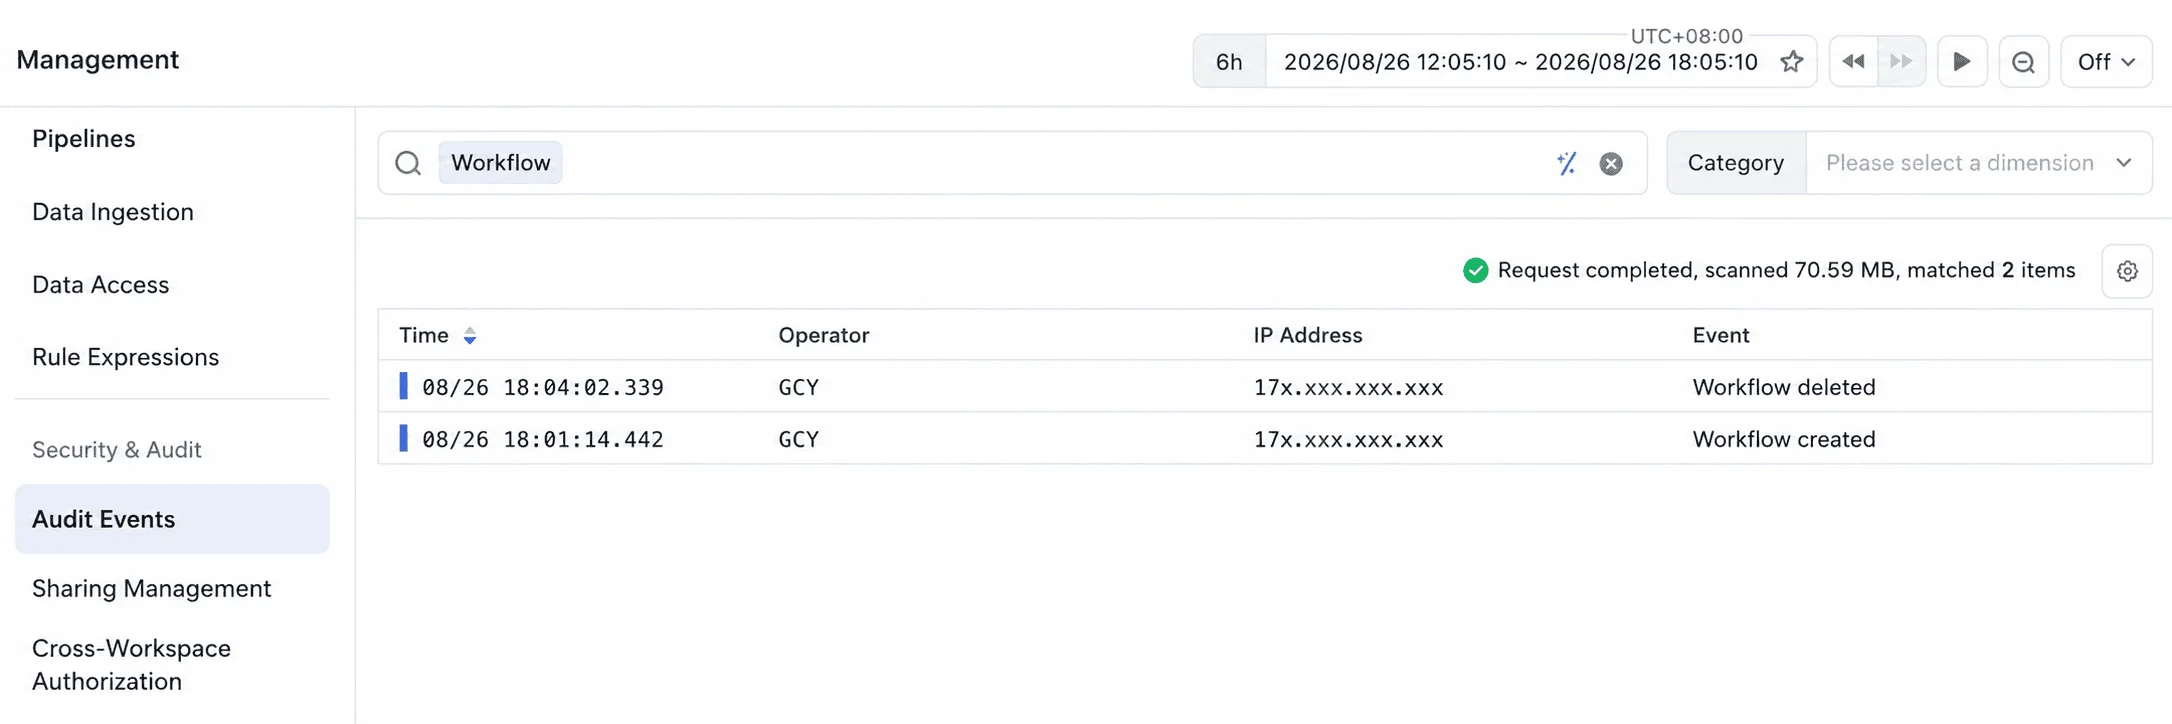
Permission and audit improvements
Delete permissions for tickets have been tightened, and audit records now cover ticket creation and deletion.
Status Page
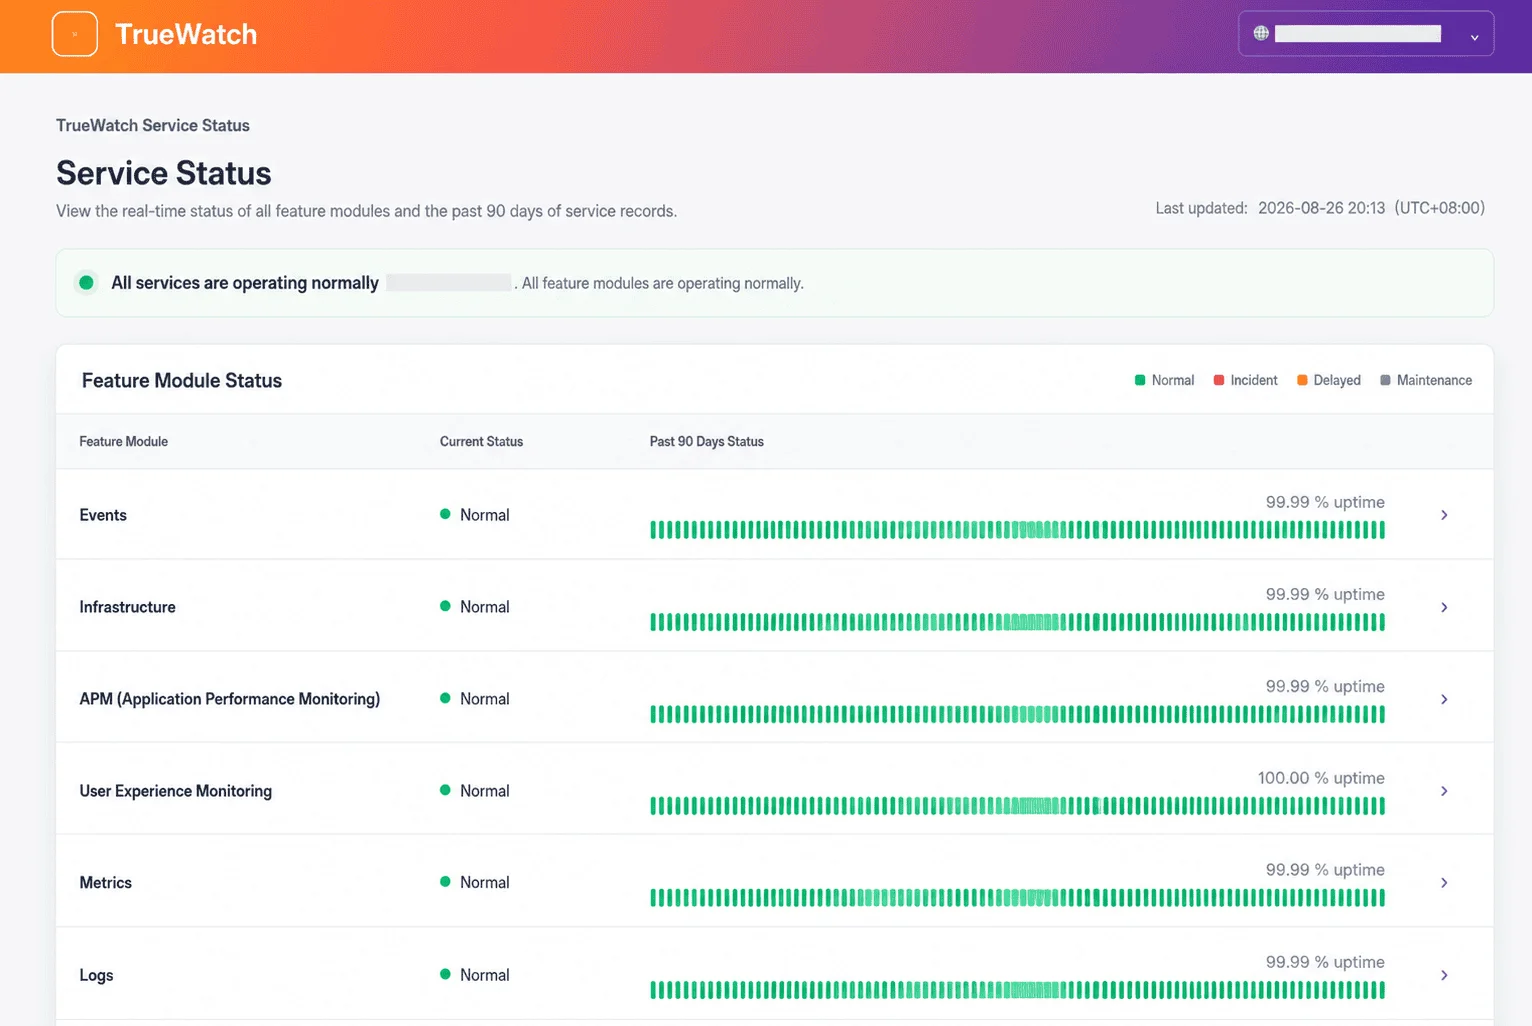
Service status and event history
Service status and historical event display have been completed, with support for viewing the last 90 days of status and the current SLA.
Other
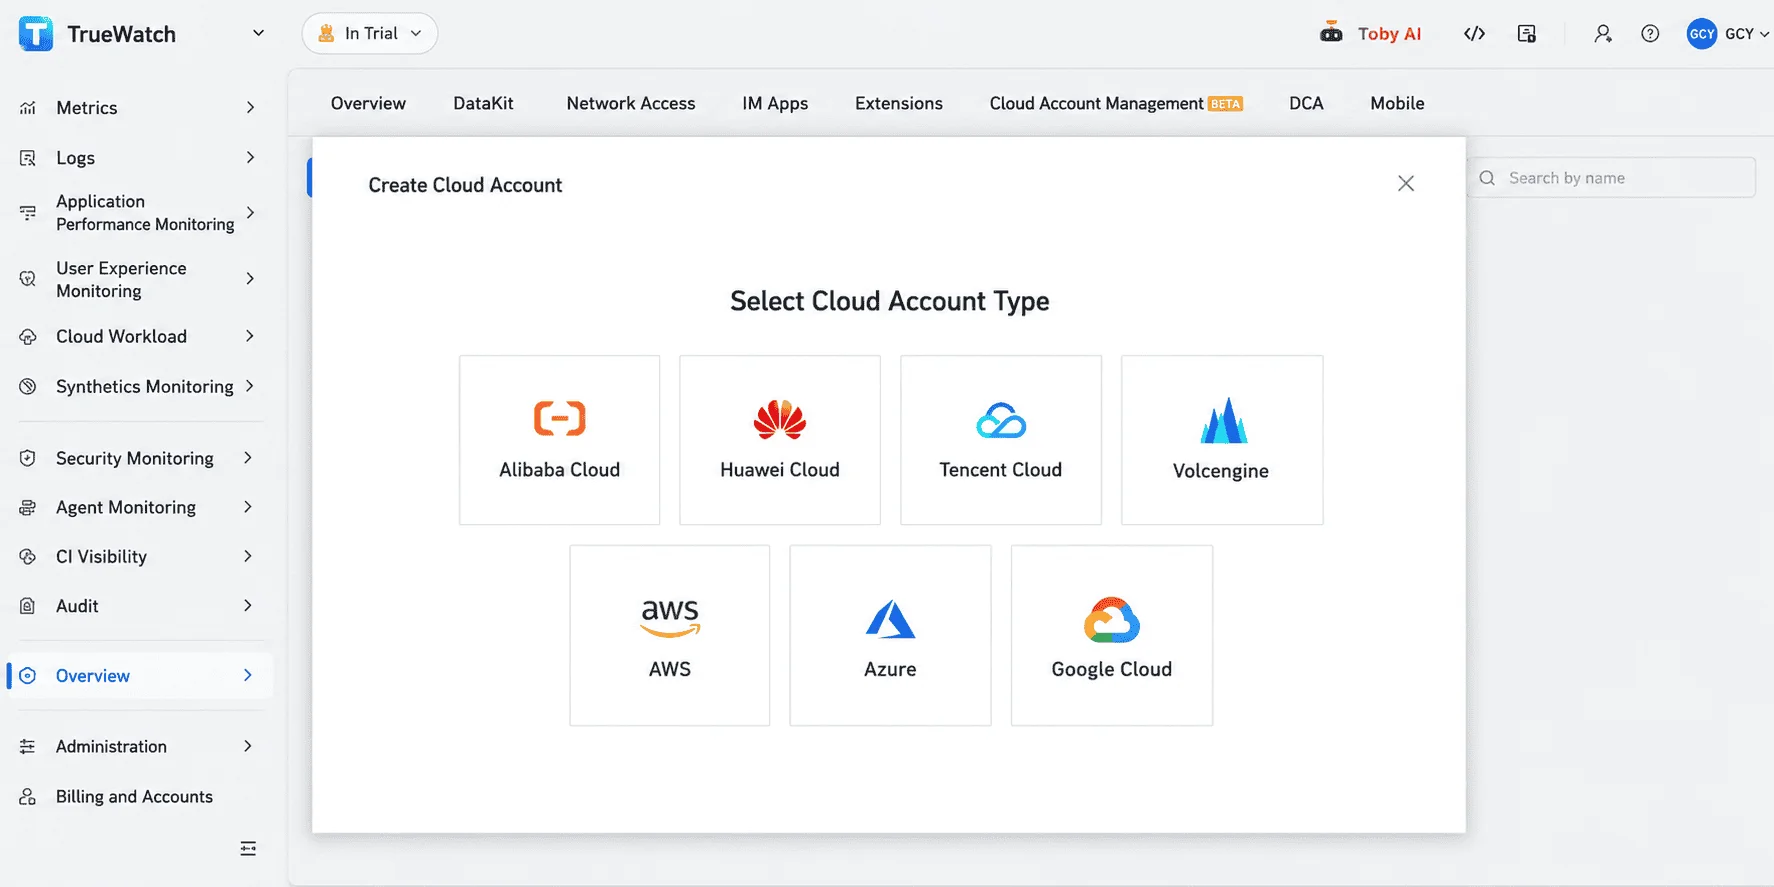
GCP and Volcengine cloud account onboarding
Google Cloud and Volcengine cloud accounts can now be connected, completing unified management across multi-cloud environments.
Console API rate limiting
General rate limiting has been added for console APIs. Access frequency limits and shared quotas can be configured for specific endpoints across different entry points, including OpenAPI, Inner API, and External API.
Clearer workspace lock status
The pages shown during the 14-day lock countdown and after a full lock now state the workspace status, the restrictions in effect, and the actions still available. The related email notifications for paused data ingestion, full lock, and restored access have been updated to match.
DataKit
New features
- A new WinNetFlow collector uses Windows ETW to collect process-level TCP and UDP network flows along with HTTP.sys request metrics.
- The MongoDB collector adds DBM support for Query Metrics, Activity, and Slow Operations. Query Metrics requires MongoDB 8.0 or later.
Improvements
- Tail sampling supports zstd v2 reporting with automatic fallback to the older protocol, and preserves predicate digests when large packets are split.
Bug Fixes
- Fixed an issue where aggregation and tail sampling ran before the Pipeline, so Pipeline results were not included in aggregation and sampling.
FAQ
What is the biggest operational update in this release?
The incident war room. A Feishu group chat can be created straight from an incident, it syncs the incident status and owner, and responders can claim or close the incident from a card in the chat, so coordination and the incident record stay aligned instead of drifting apart across two tools.
What changed for Toby AI TruePilot and Toby AI Agents?
AI API calls are now metered as task invocations and can be billed per call, with usage tracked per sub-project, and alerting strategies carry an Agent-type identifier. For Toby AI Agents, the built-in OWL Skills were rewritten around business scenarios and output standards, which improves the stability and accuracy of tool calls.
Why does this release matter for teams running their own AI agents?
Agent Monitoring now parses input, output, and token fields from LangChain OpenTelemetry data, and adds Prompt Eval, Schema Eval, online evaluation, and batch evaluation with result analysis. That moves agent quality from an impression to something measured on the same platform as the rest of the stack.