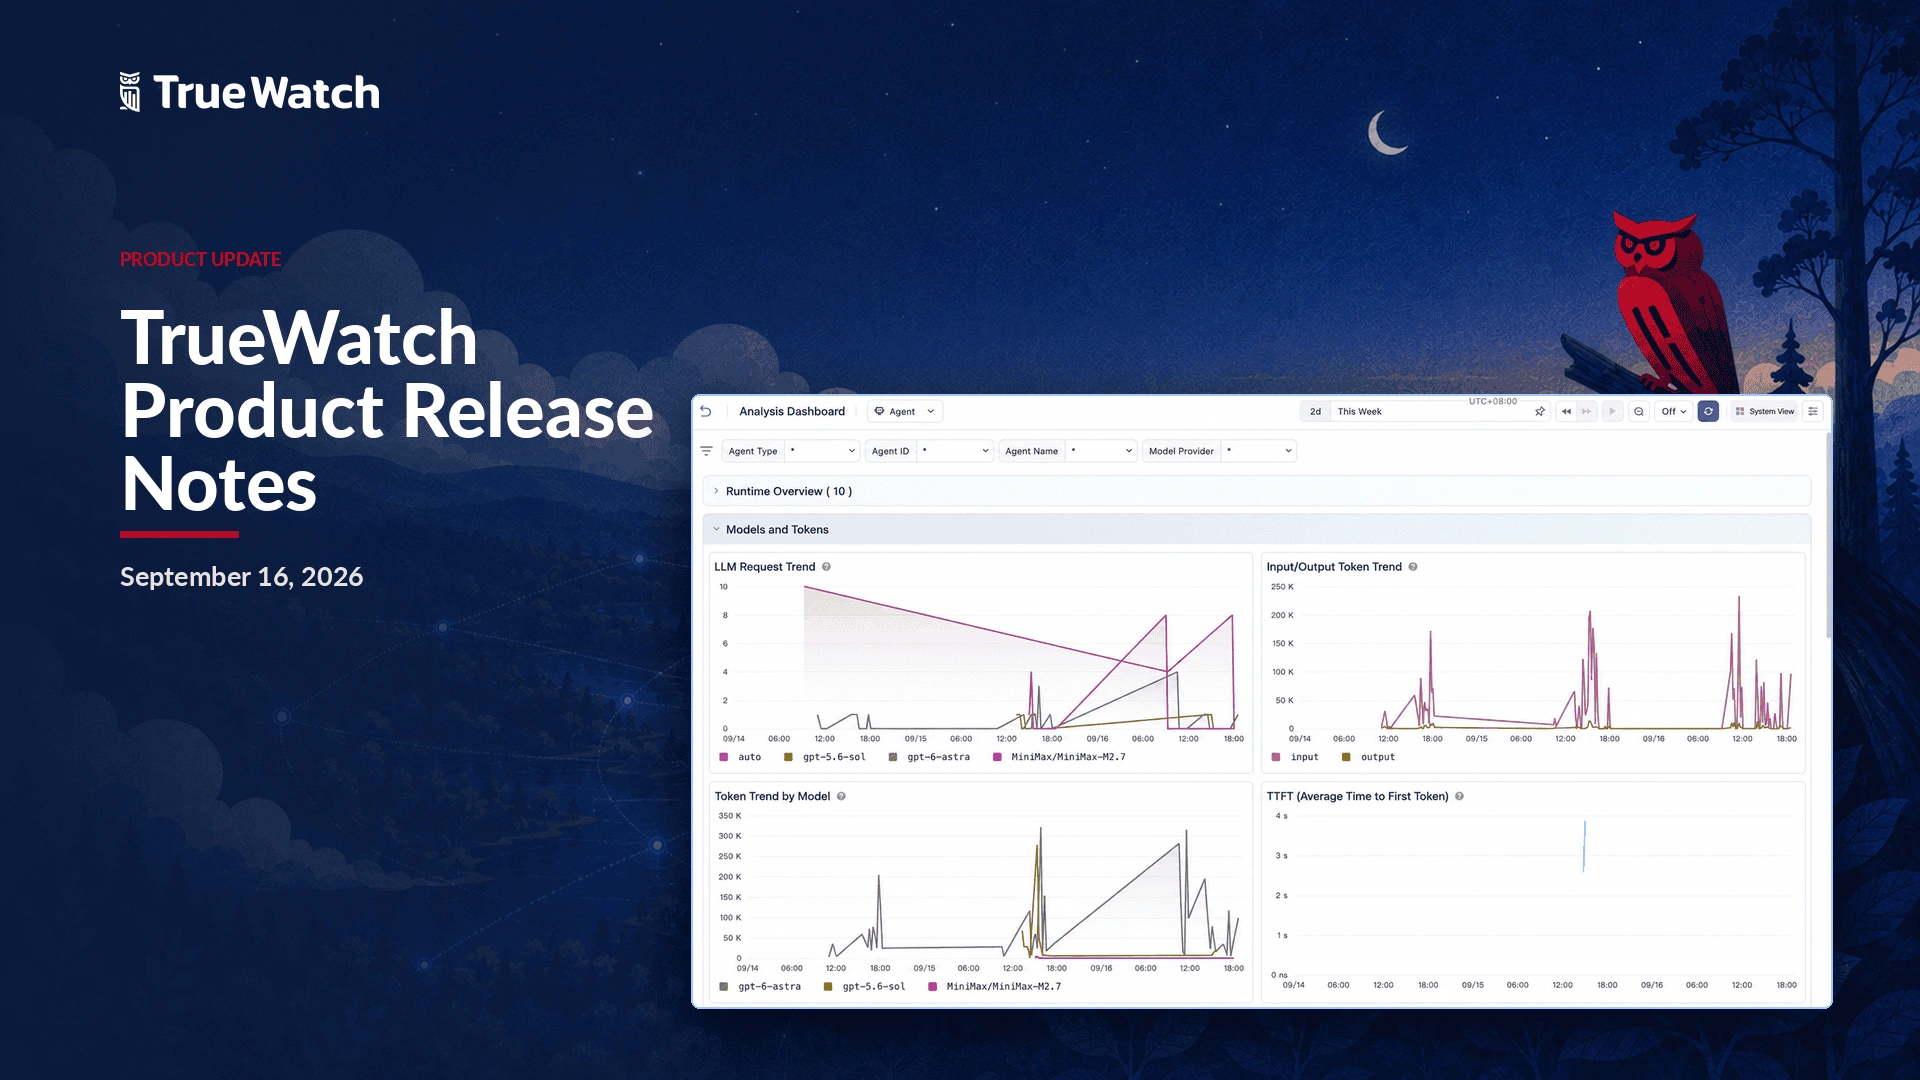
The TrueWatch product release notes for September 16, 2026 cover streaming output and remote code search in Toby AI Agents, AI semantic monitors that you describe in natural language, forecasted budget overrun alerts, a new incident statistics chart, topology drill-down in Unified Catalog, resource call relationships in trace details, and a round of integration and DataKit updates.
Billing And Plans
Metric billing follows the cost center account
Billing for a paid workspace is now determined by the cost center account it is bound to. Cost center accounts created after this release bill their paid workspaces by data points by default. Existing cost center accounts keep their current billing method, and the paid workspaces bound to them continue to bill by timeline or by data points as before.
Longer metric retention with tiered precision
Long-term metric storage adds 540-day and 720-day retention options, and the default precision of every long-term option changes. Data inside the standard retention window keeps its original precision. Data beyond that window and within 90 days is stored at 1-minute precision, data between 90 and 180 days at 5-minute precision, and data from 180 days to the end of the total retention period at 10-minute precision.
Toby AI Agents
Streaming agent output
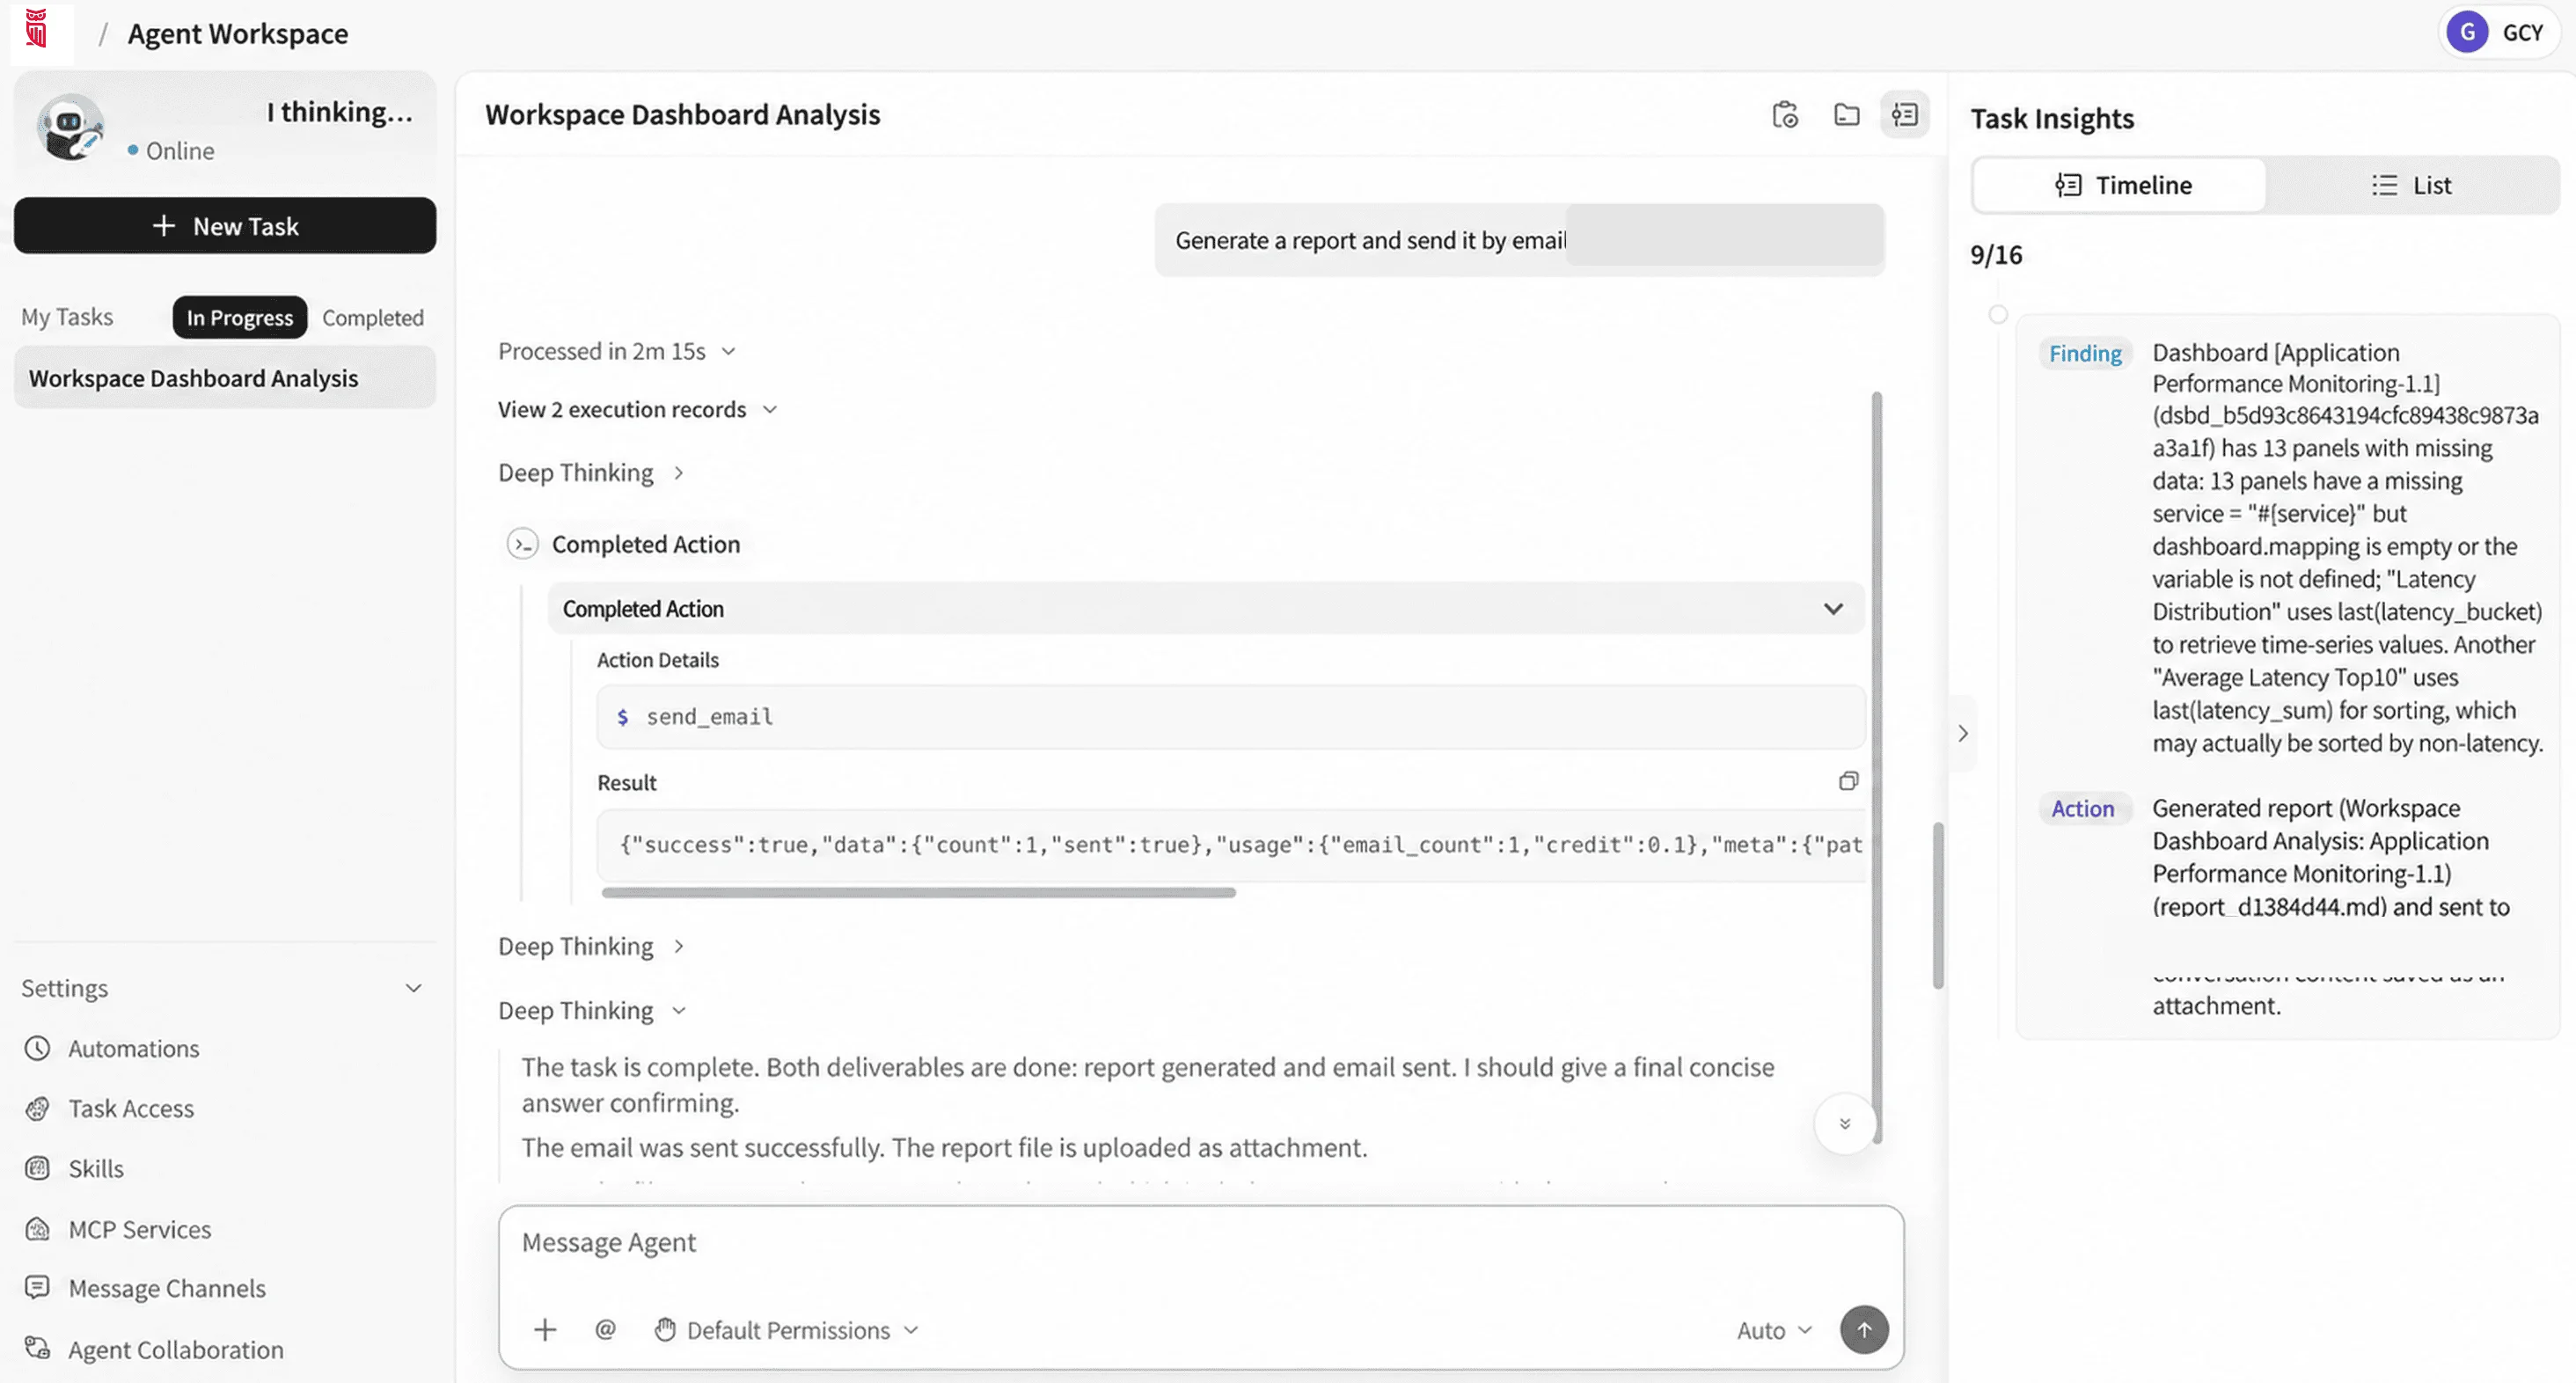
Toby AI Agents stream their reasoning process and answer in real time, so you can follow task progress as it happens instead of waiting for a finished response.
Remote code search
Toby AI Agents integrate the git-rg tool and its companion Skill, which makes it possible to search GitHub and GitLab code without cloning the repository. Code analysis and root cause localization get faster because no local checkout is required.
More reliable preset template sync
Template sync and update logic has been reworked so that the latest preset agent templates are easier to pick up and use.
Markdown agent email rendered as HTML
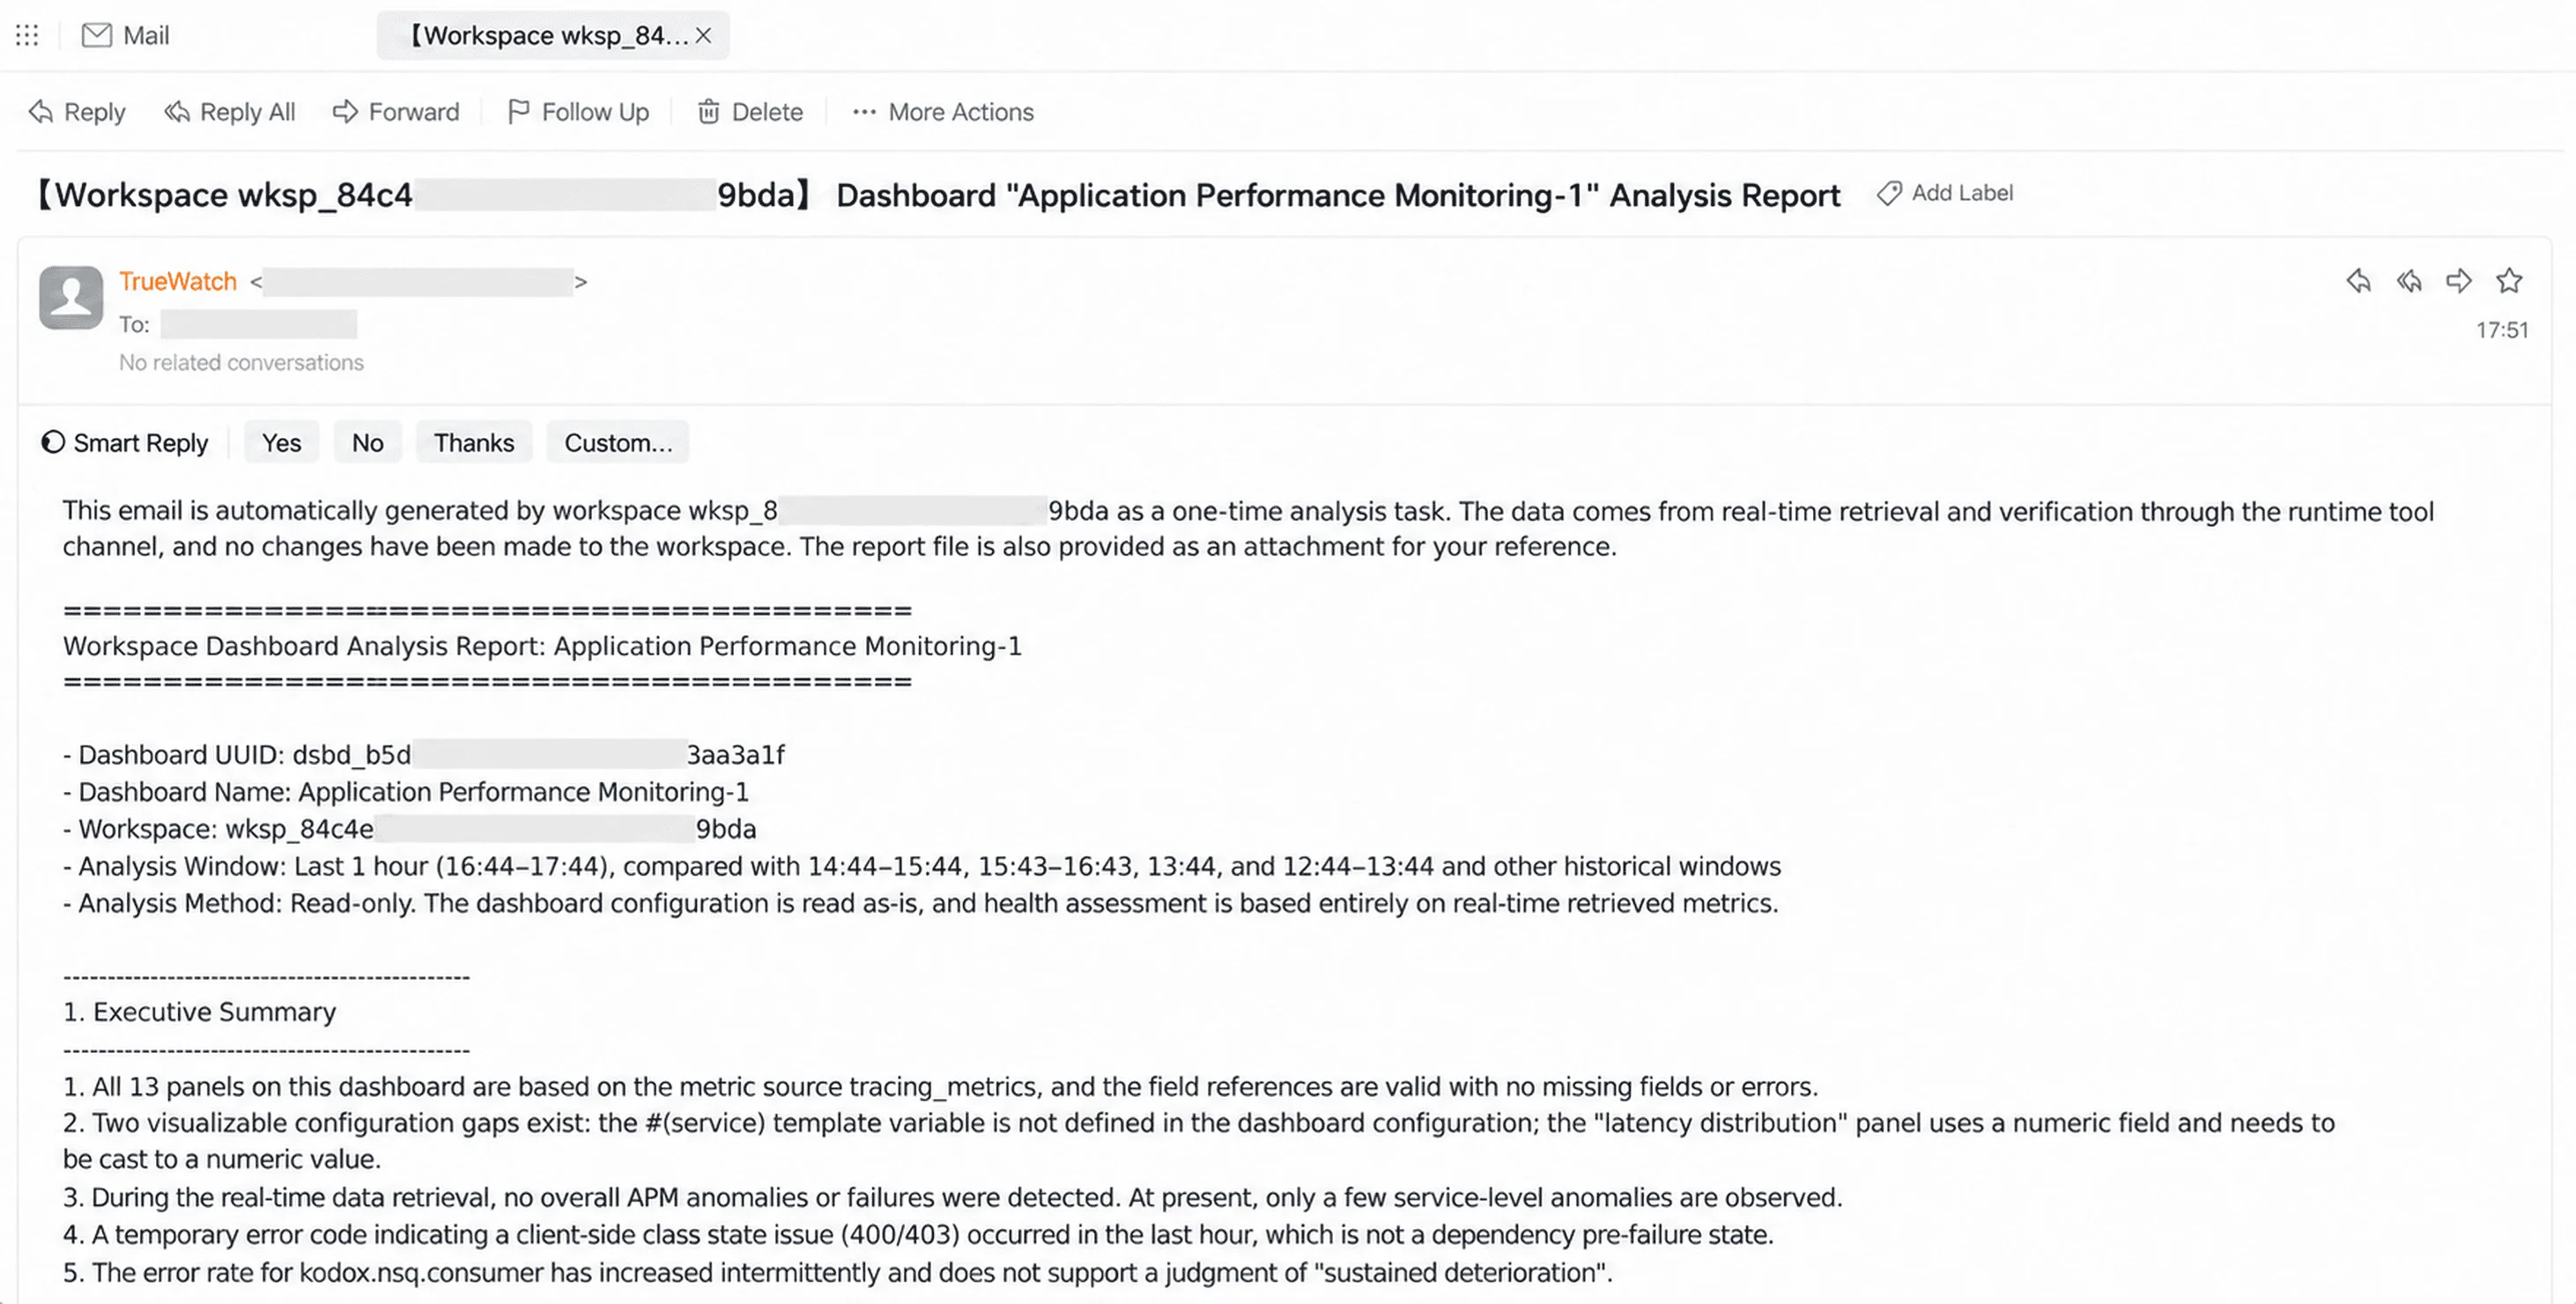
Agents convert Markdown content into HTML email, preserving formatting and content hierarchy so the result stays readable in an inbox.
Monitors
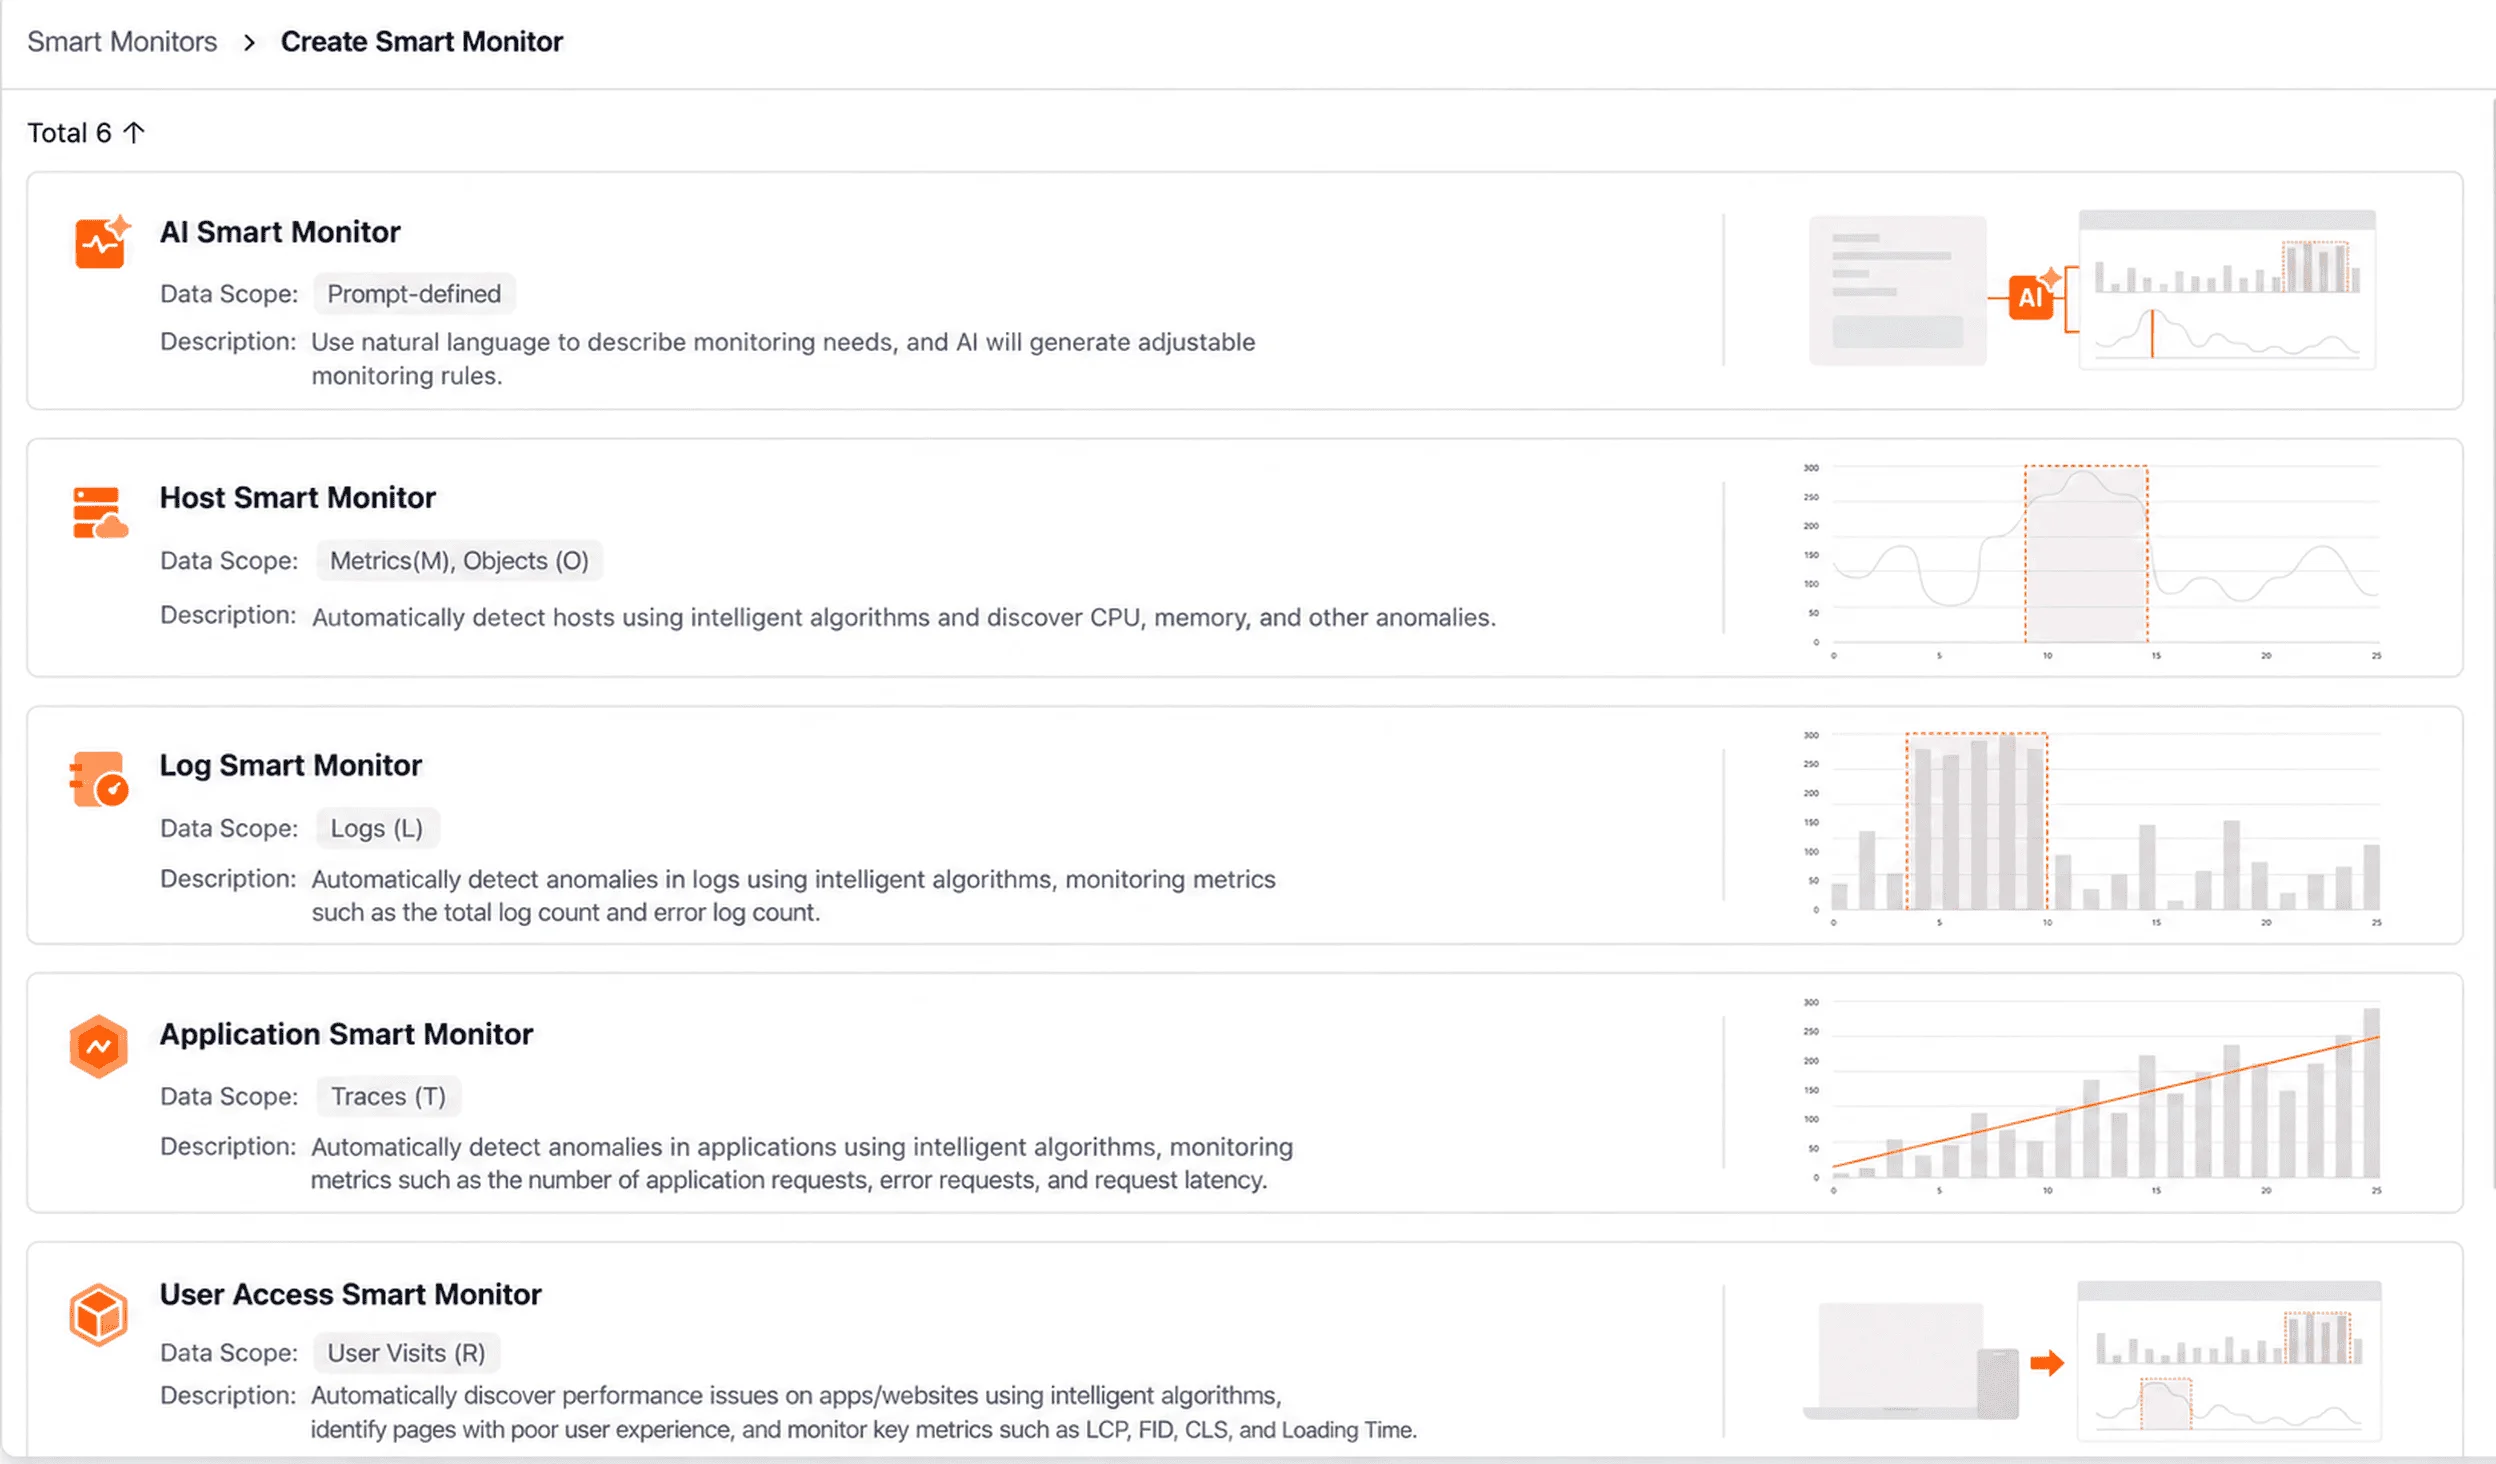
AI semantic monitors
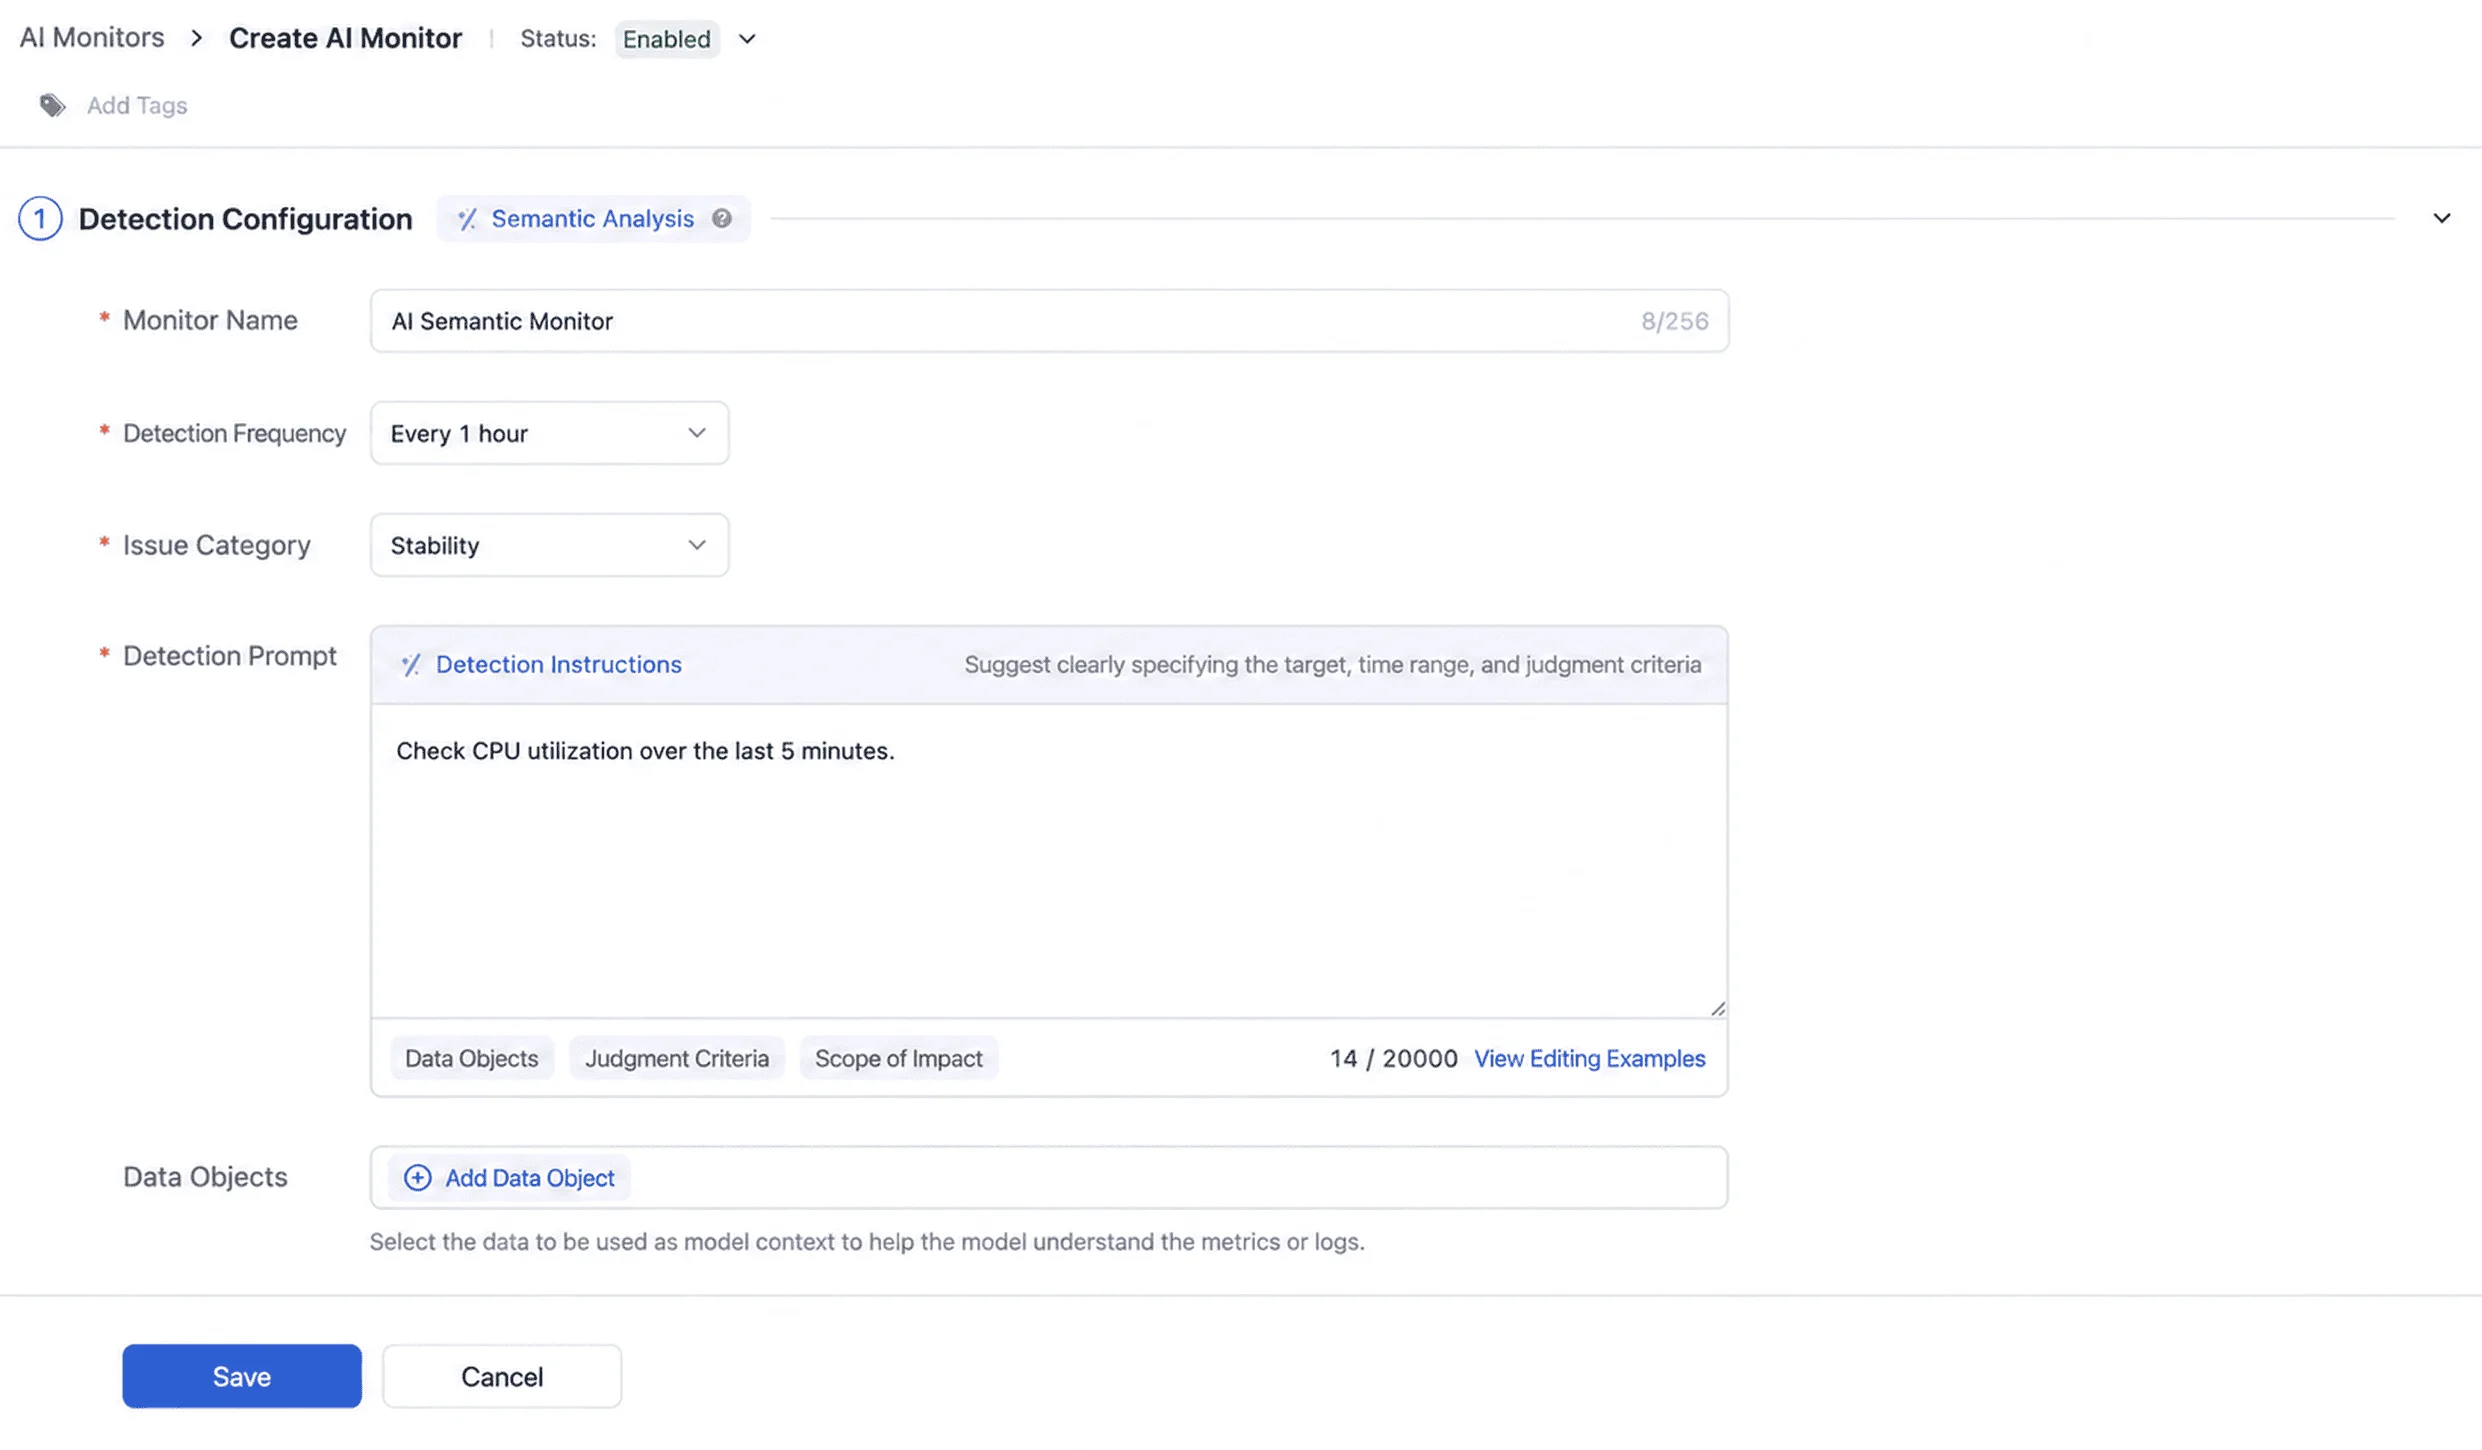
A new AI semantic monitor lets you describe the detection target in natural language. The AI analyzes observability data on a schedule and generates anomaly events, so you can surface and locate problems without hand-writing a detection rule.
Upgraded smart monitor configuration
A new AI smart monitor type generates detection rules from natural language. Other smart monitor types now load built-in default rules at creation time, with thresholds you can adjust as needed, which shortens the path from creating a monitor to running it.
Cloud Billing
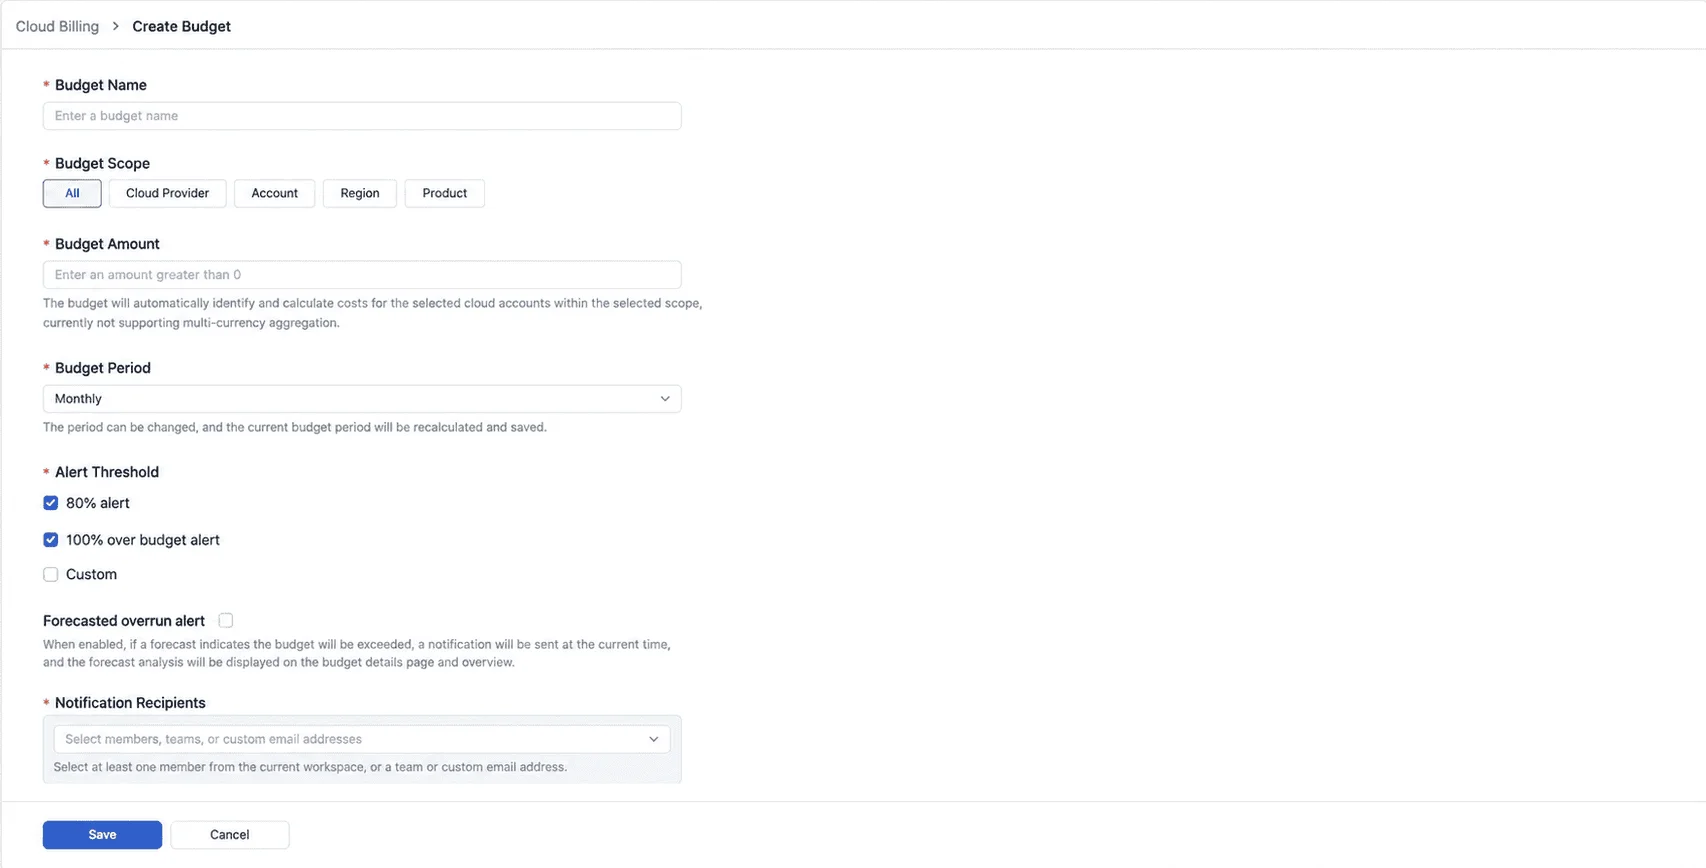
Forecasted budget overrun alerts
Budget rules add a Forecasted overrun alert option. The alert triggers when forecasted end-of-period spend reaches 90% of the budget, or when the budget is expected to be exceeded within the next 7 days. Using the cumulative spend trend of the current period, TrueWatch forecasts end-of-period spend, expected utilization, overrun amount, and the first overrun date every day, and shows them consistently in the budget list, the budget detail page, and the analysis overview.
Streamlined budget management
Creating a budget moves from a modal into a dedicated page. The budget list adds creator, creation time, updater, and update time, so rule changes can be traced back to a person.
Dashboards
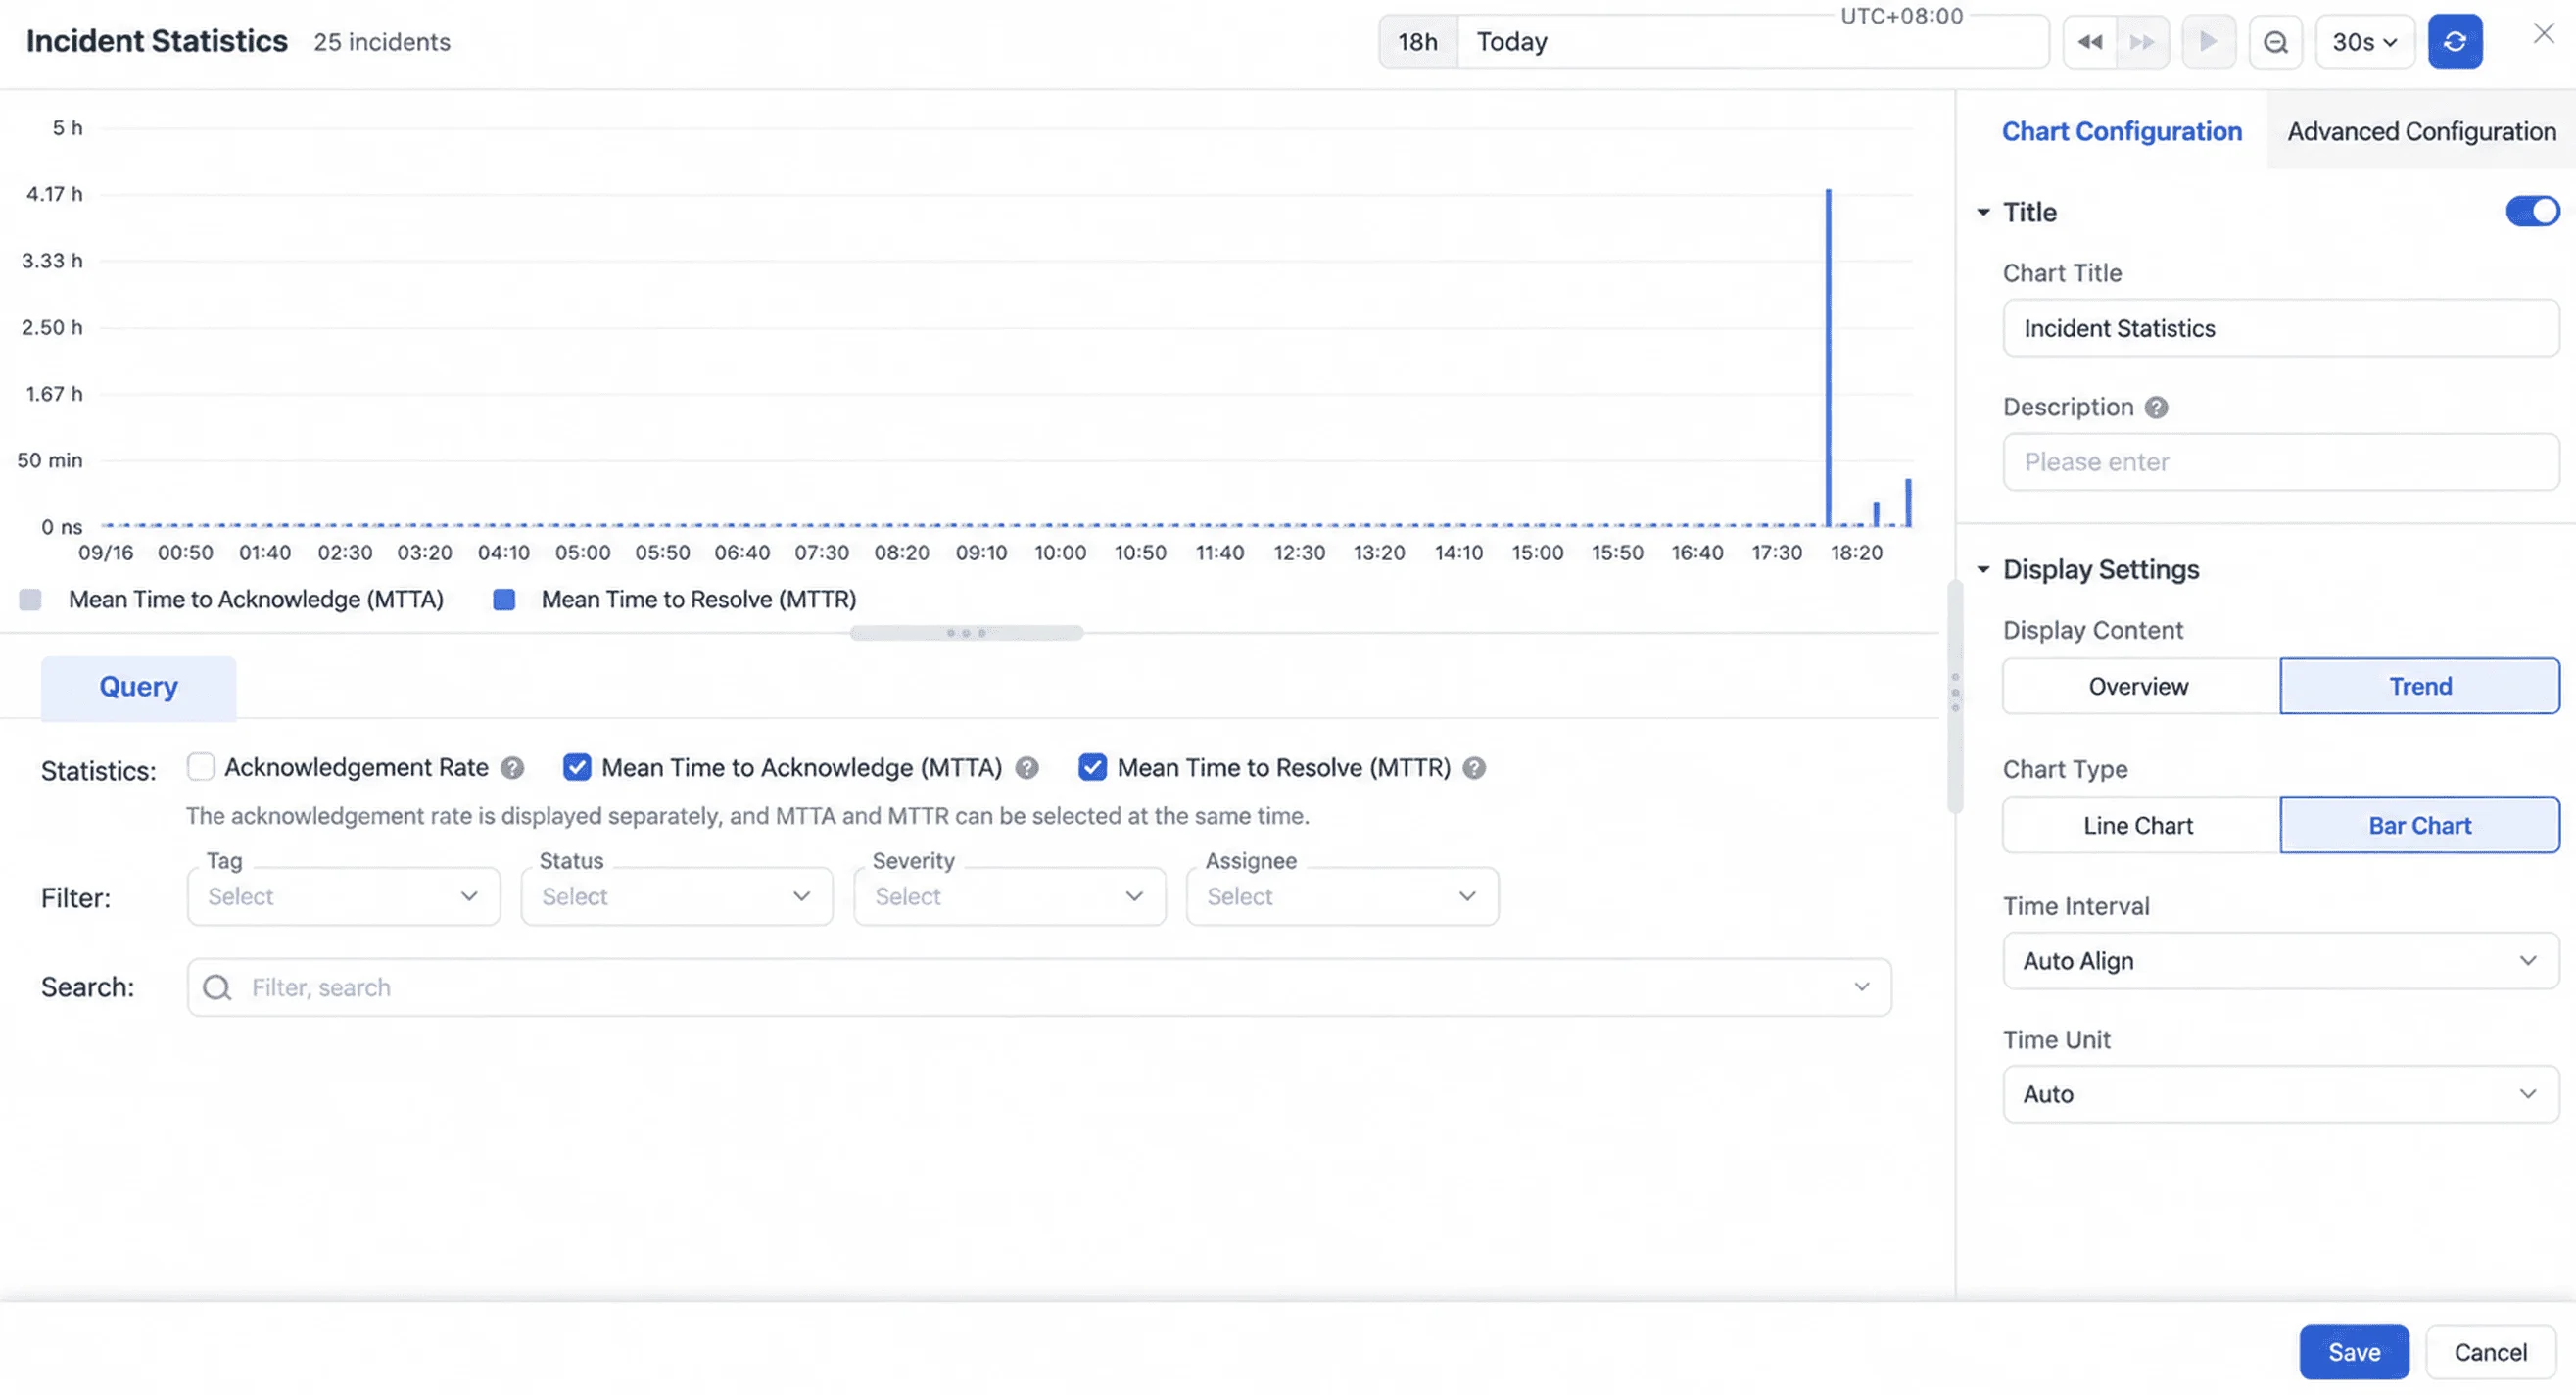
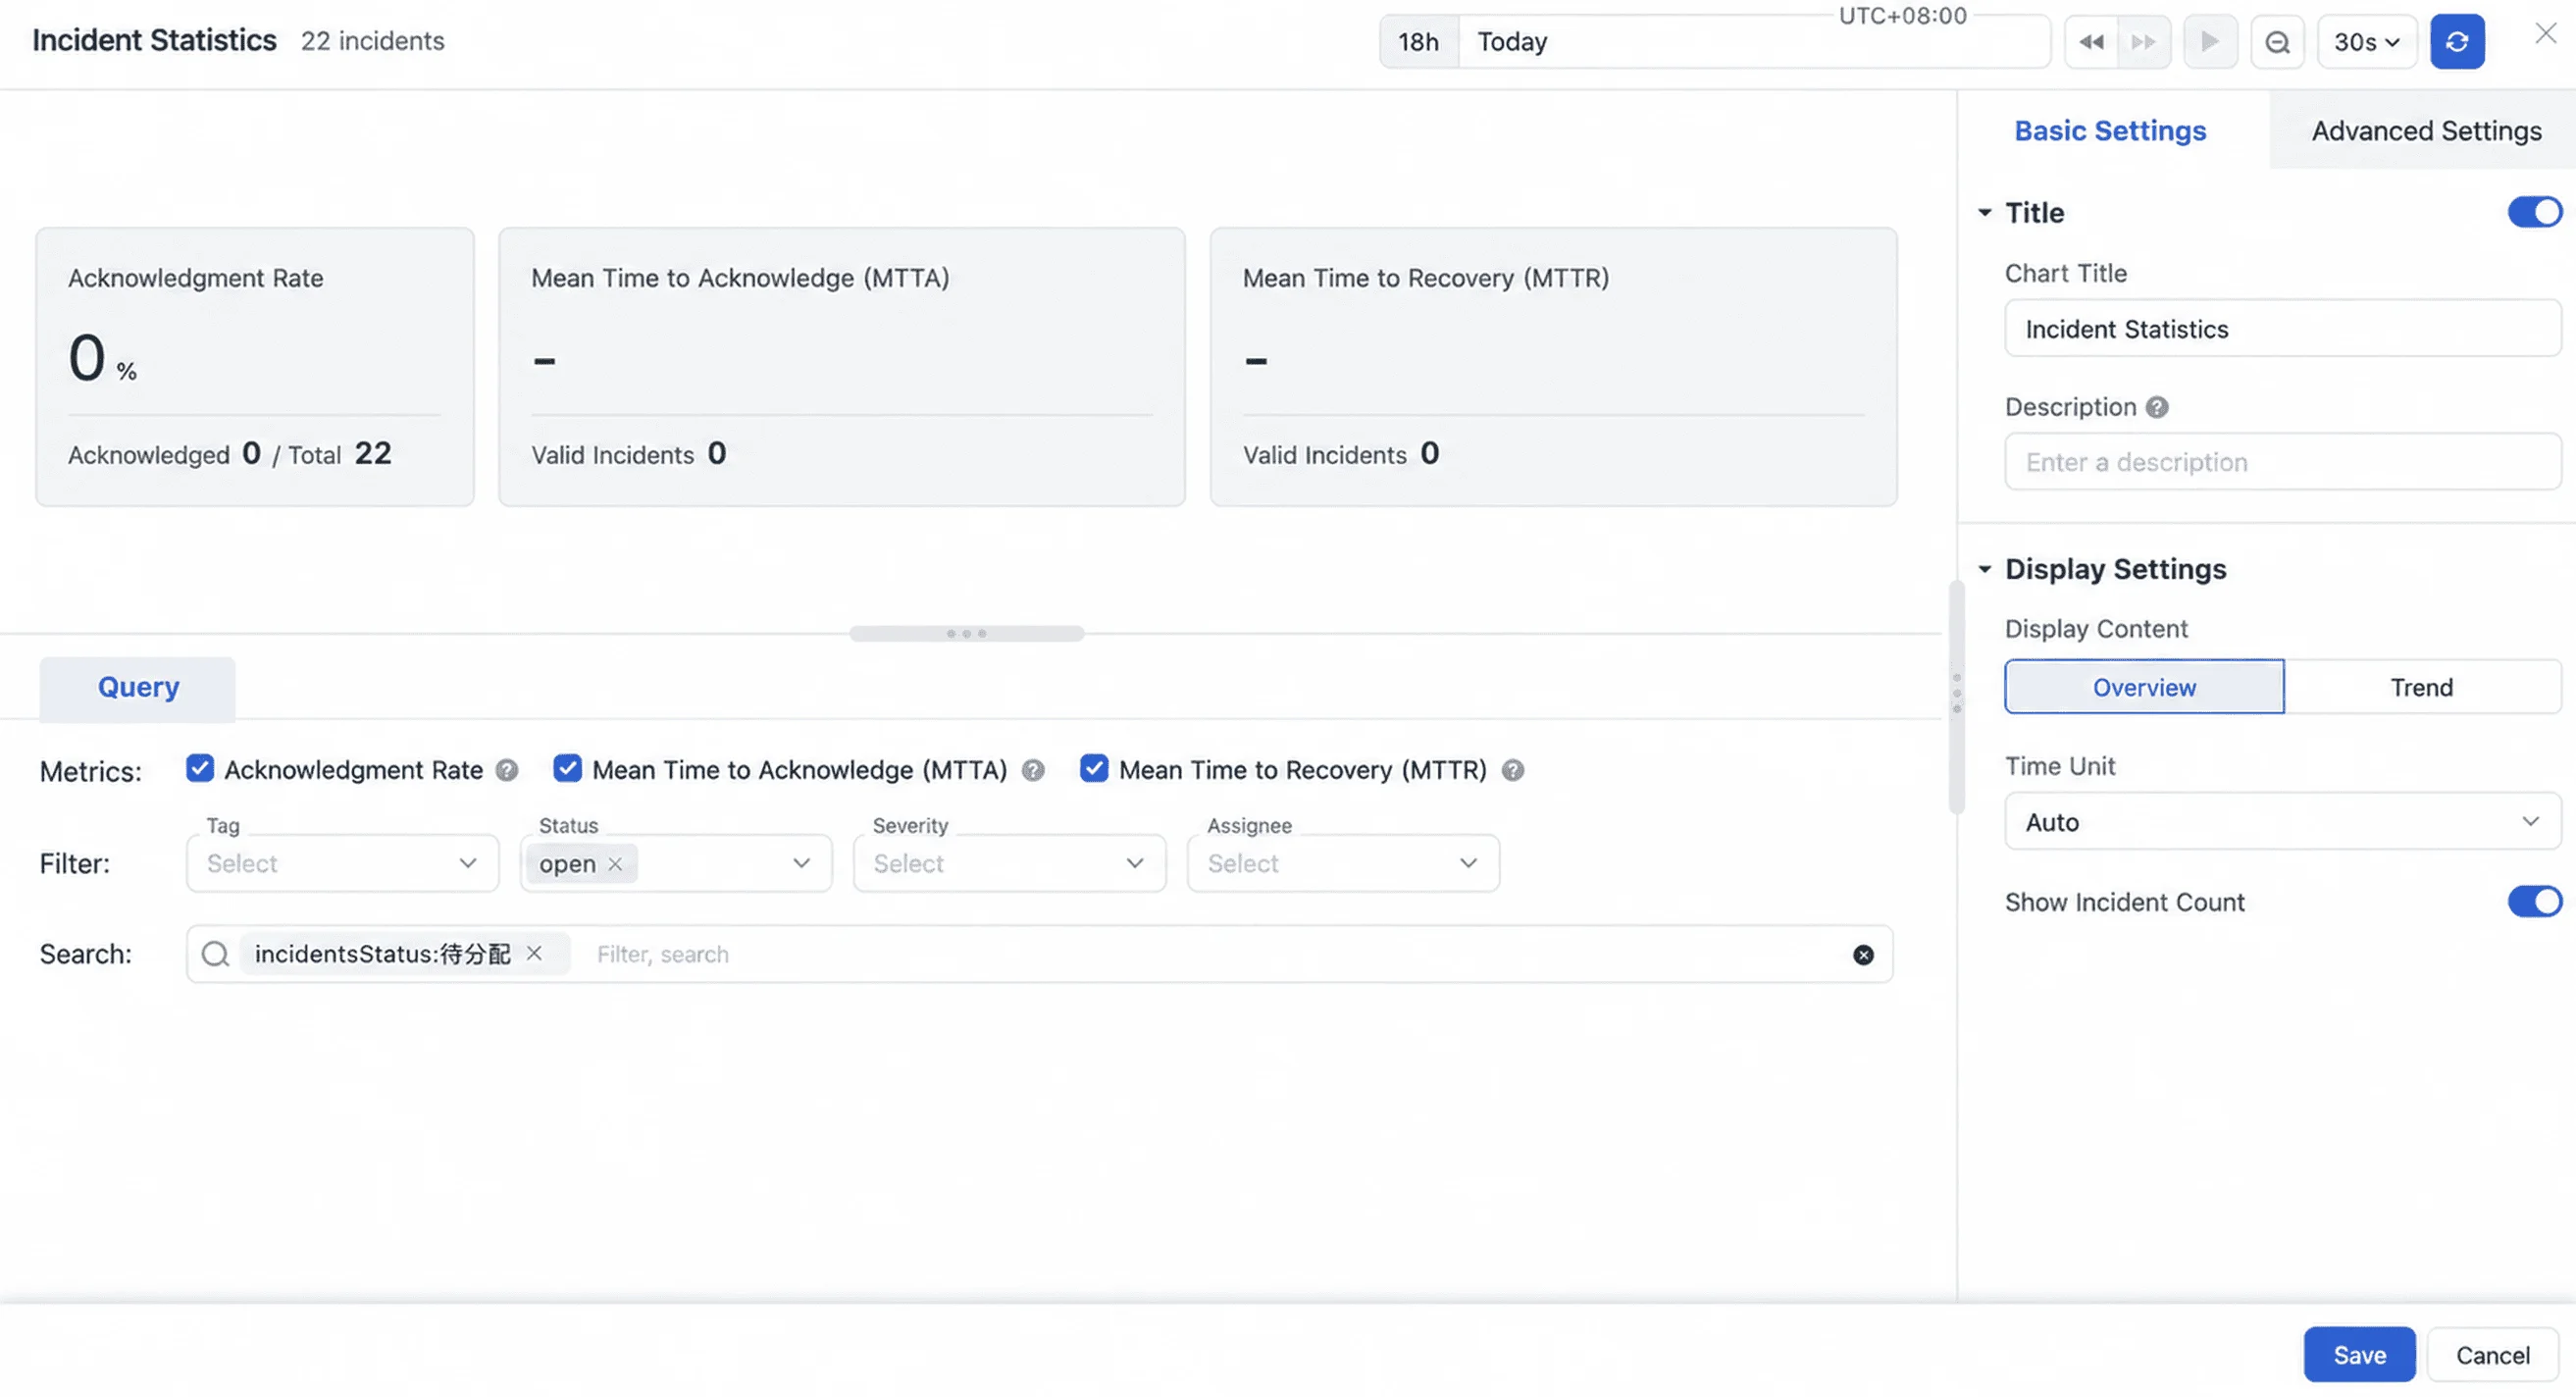
Incident statistics chart
A new incident statistics chart supports custom metrics such as acknowledgement rate, MTTA (mean time to acknowledge), and MTTR (mean time to resolve), displayed as cards, charts, or tables. Teams can measure how efficiently incidents are being handled without exporting data elsewhere.
Agent Monitoring
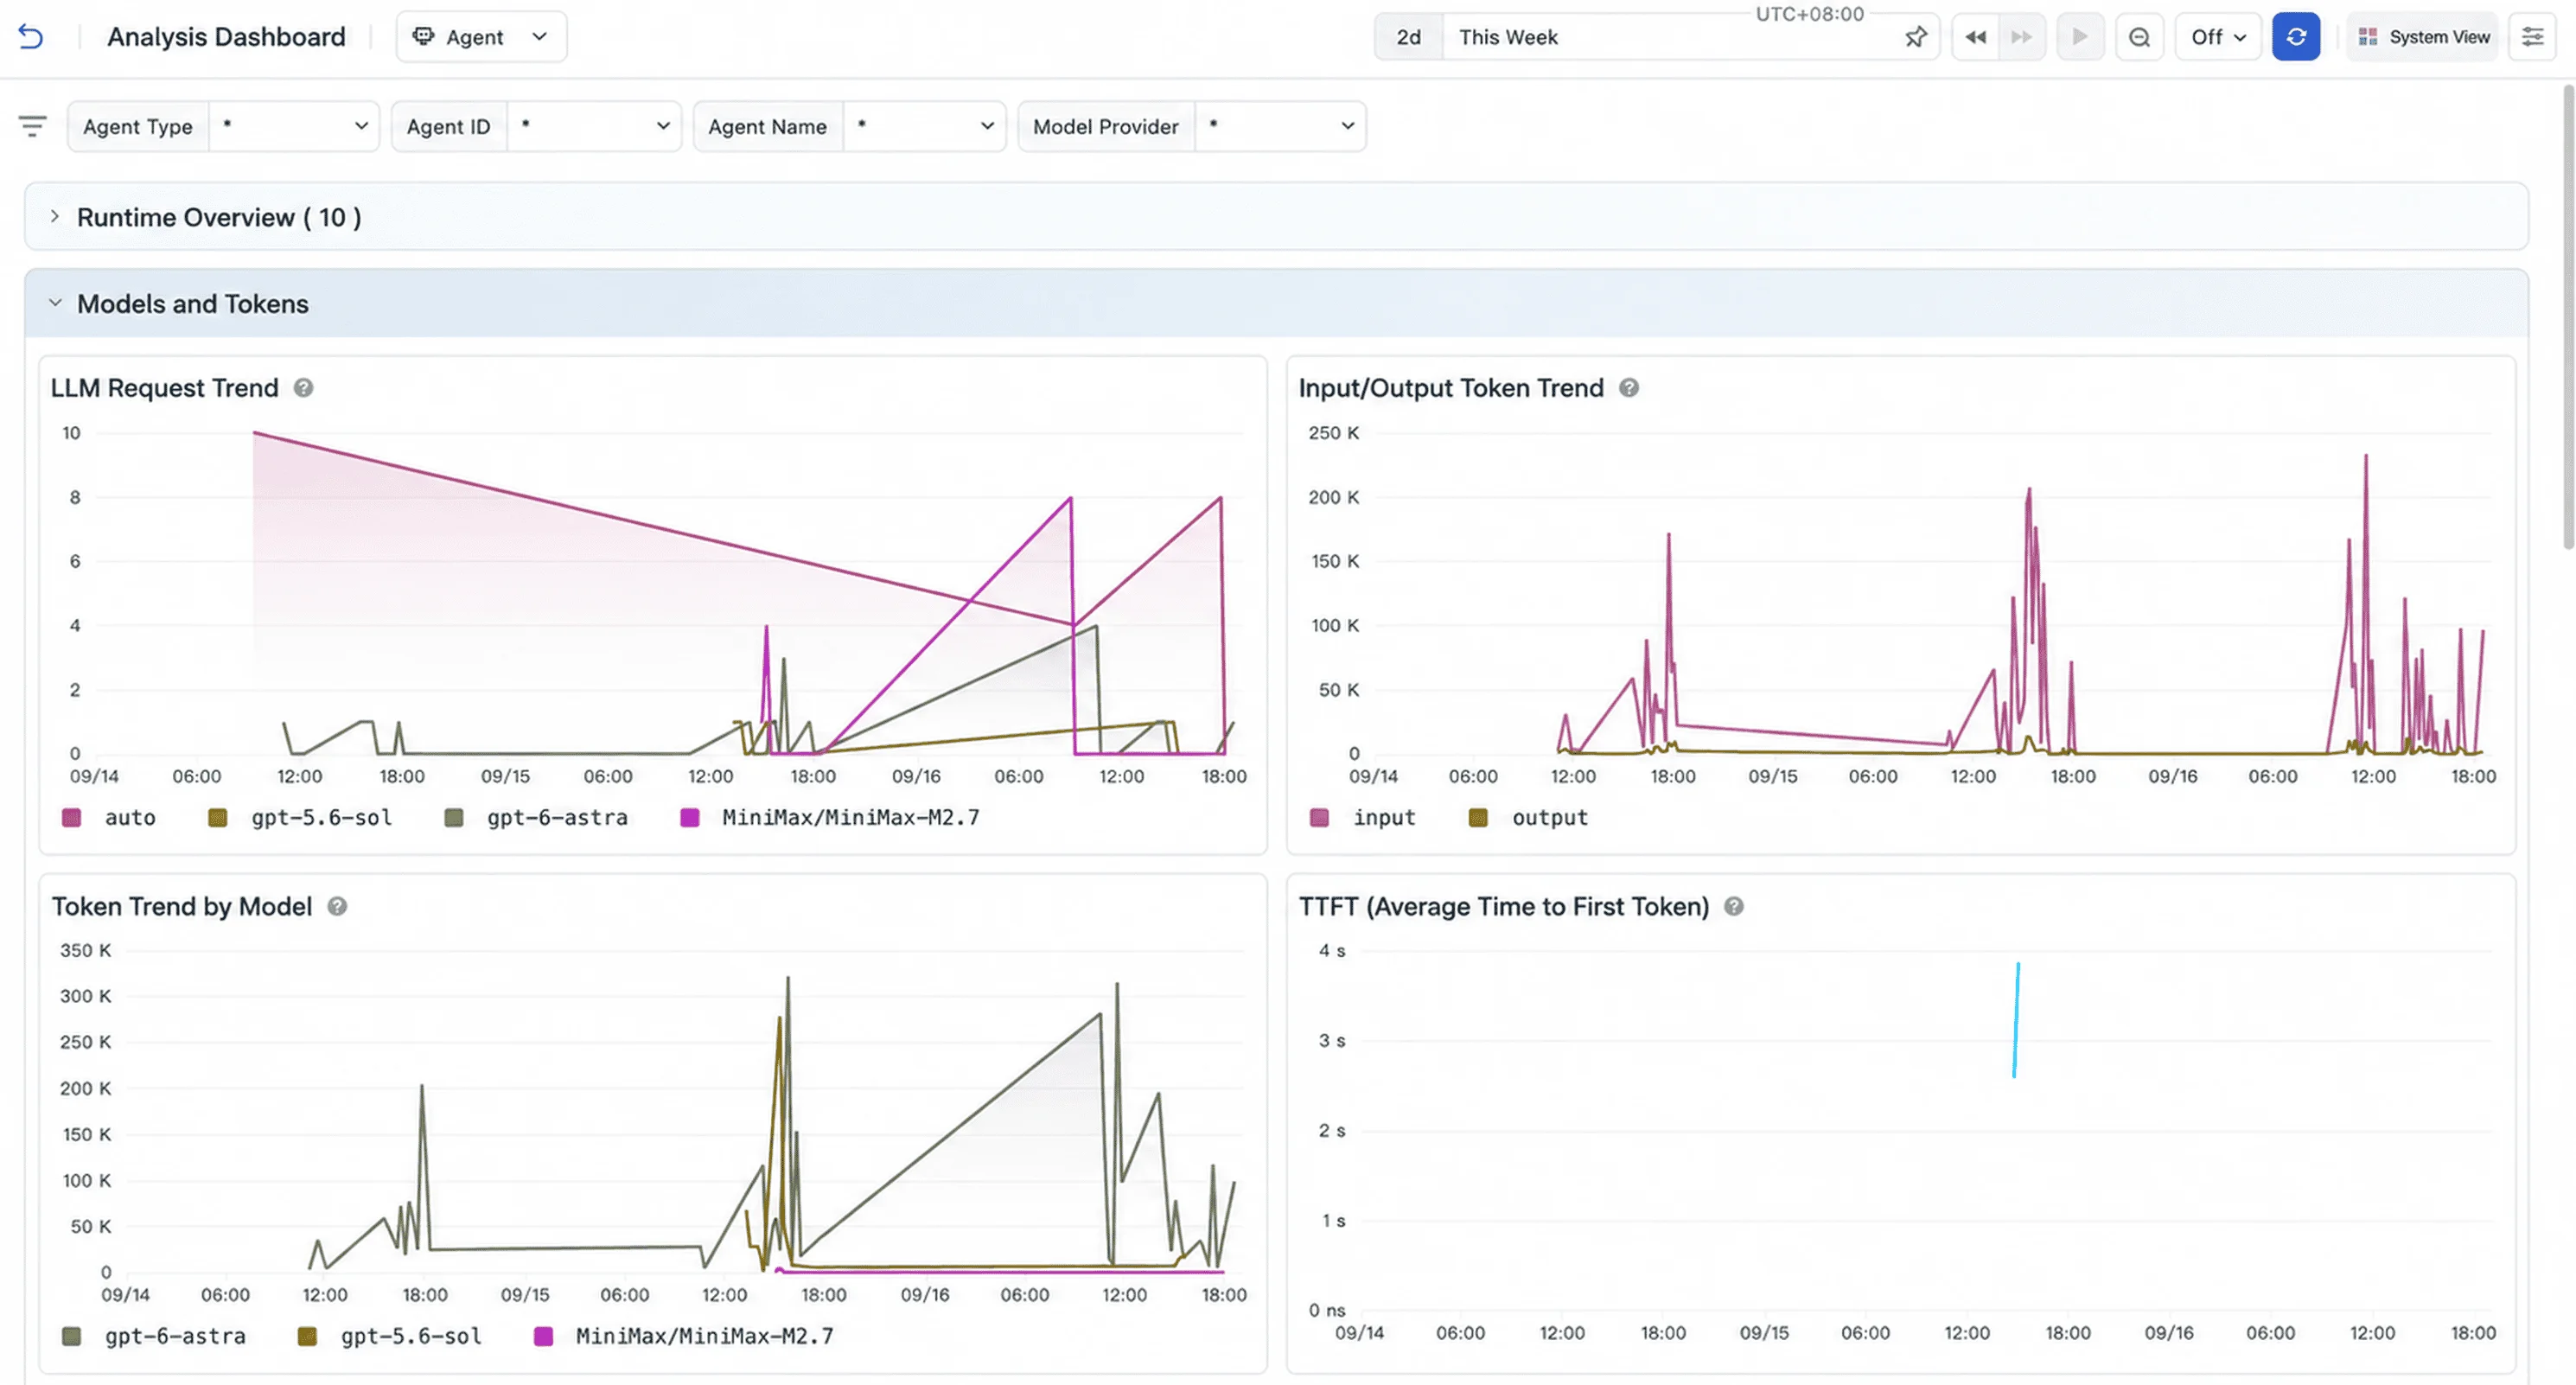
TTFT metric
The Agent Monitoring analysis dashboard adds TTFT (time to first token), reported as an average, so you can evaluate how quickly an agent returns its first token.
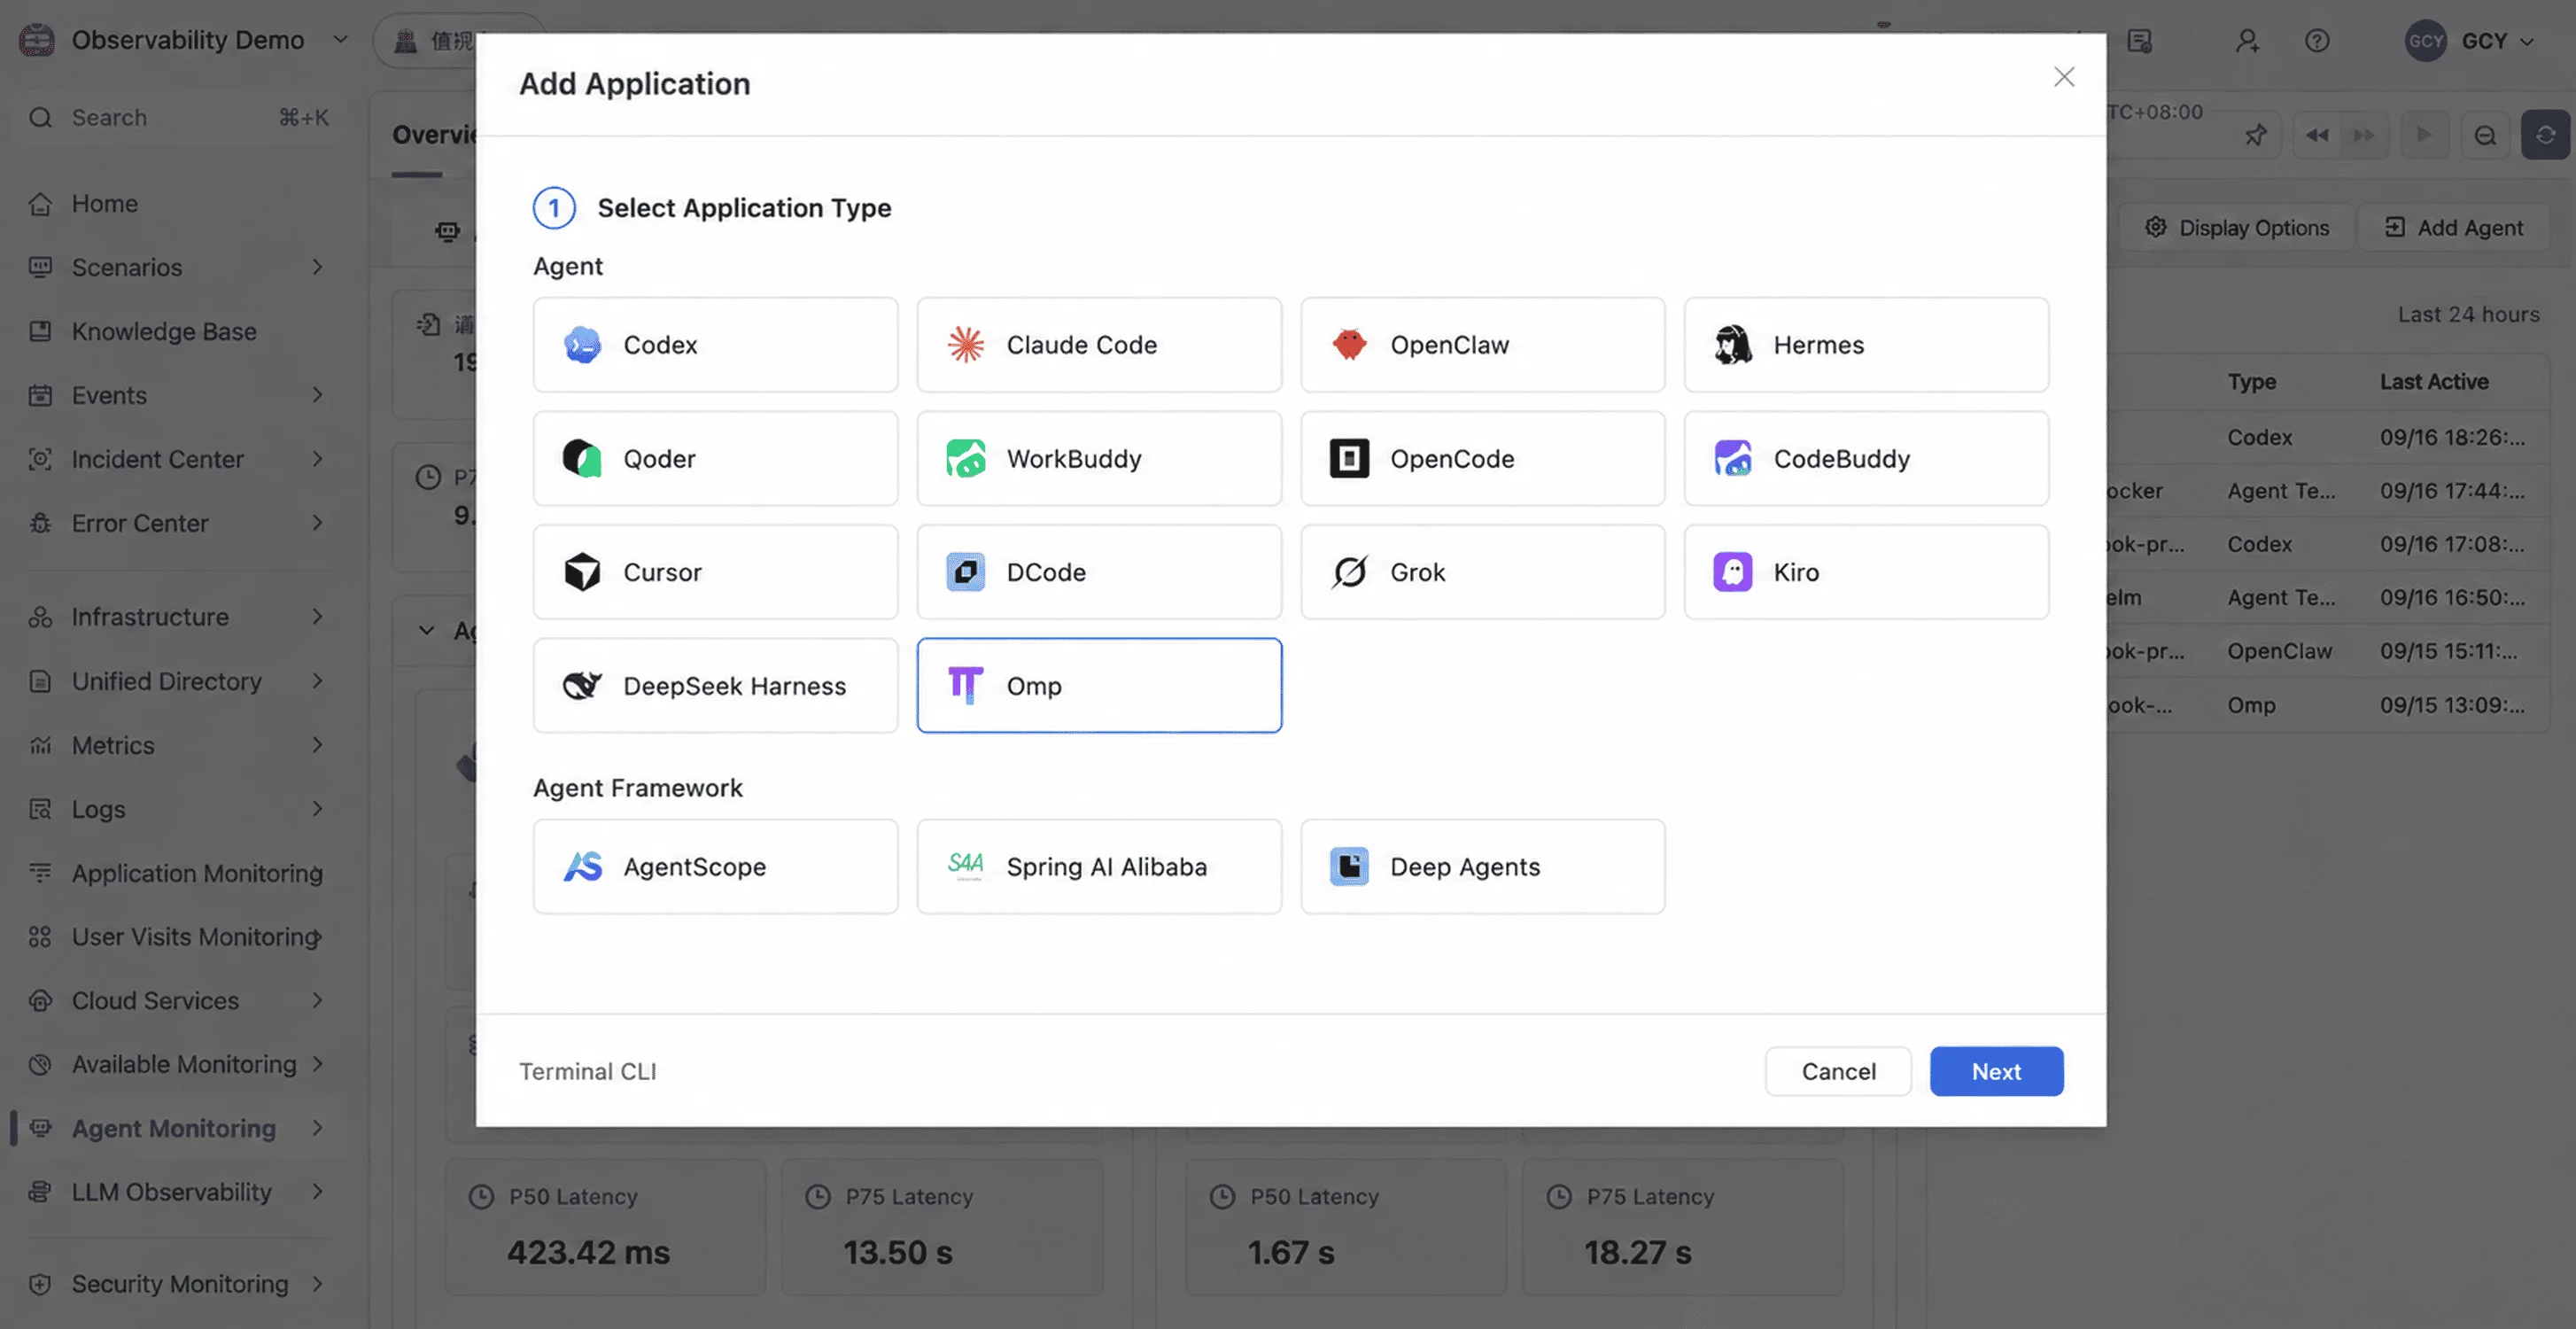
OMP Agent application type
Agent Monitoring adds support for onboarding OMP Agent applications.
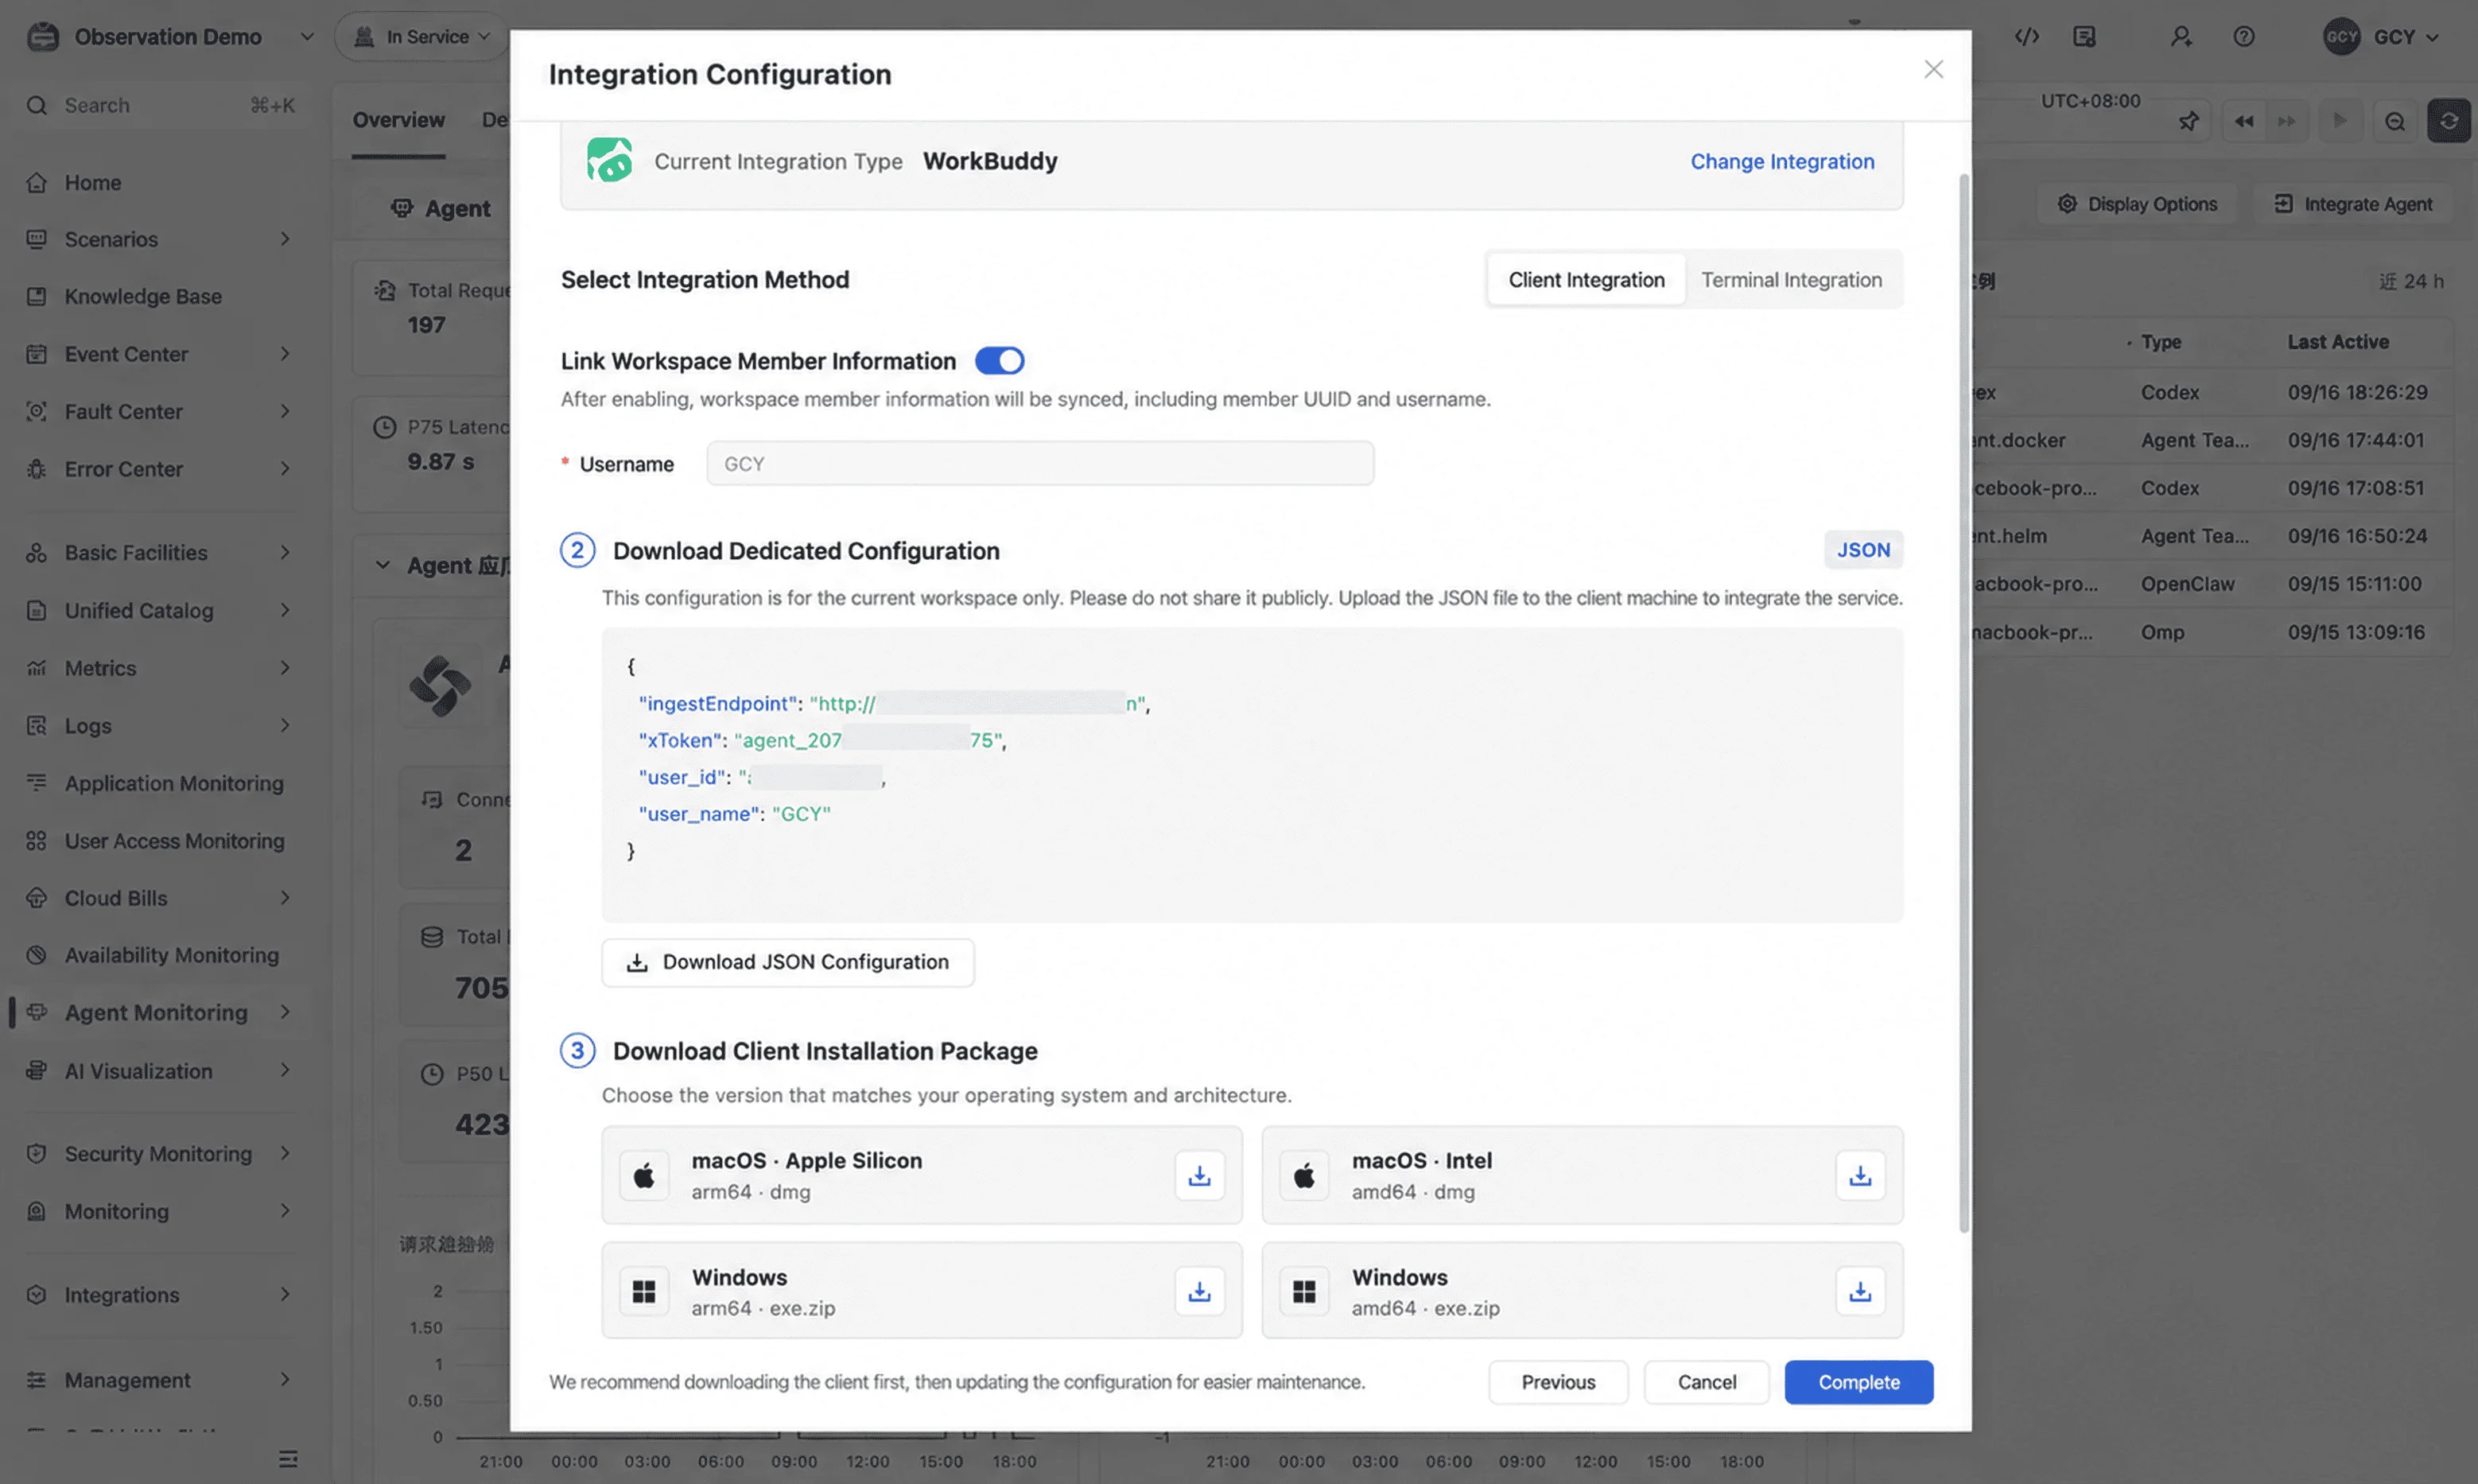
WorkBuddy client support
The Agent Meter client adds WorkBuddy support, which exposes detailed agent consumption data for that client.
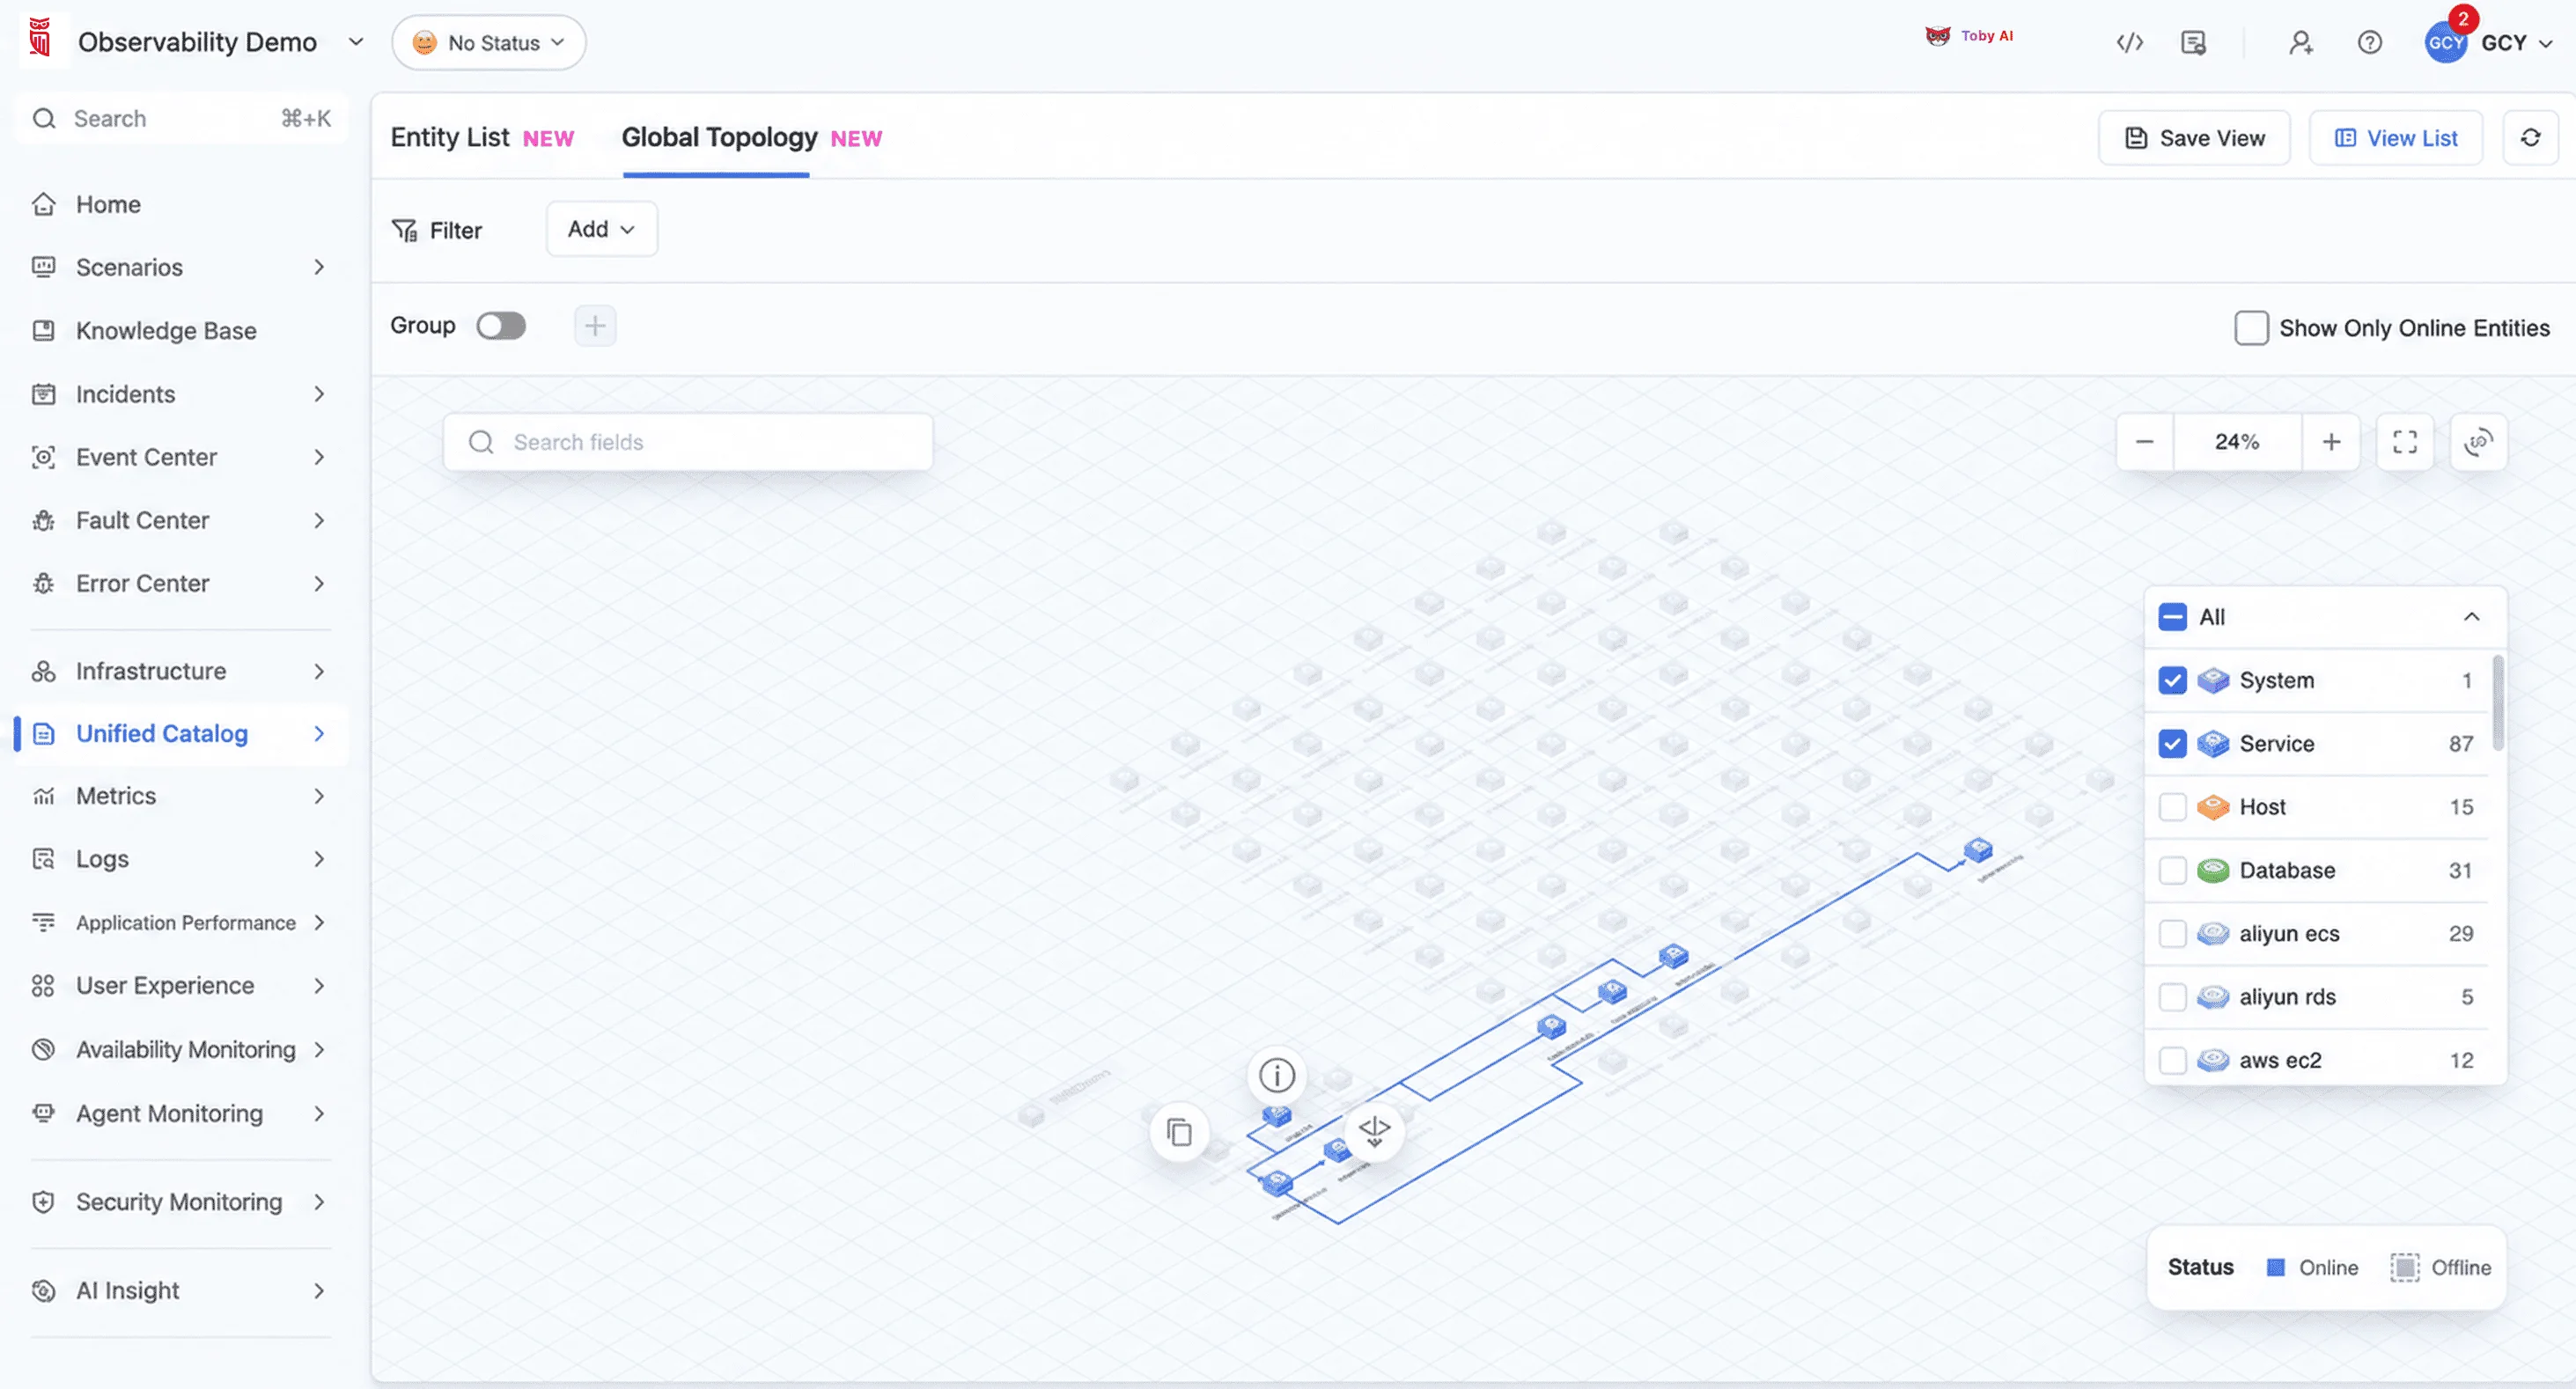
Unified Catalog
Topology drill-down and level navigation
The full-view topology supports entering a sub-topology from a node, with back to previous level, exit to global topology, and breadcrumb navigation, so entity relationships can be explored one layer at a time.
Radial topology action menu
Actions that used to live in the node info box move to a floating radial menu, which shows Copy Name, View Information, Enter Topology, and other actions according to what each node supports.
Cleaner topology edge routing
Edges are routed with a diagonal-free Manhattan Best-First pathfinding algorithm, so connections automatically avoid nodes and titles and the topology stays readable at higher entity counts.
Application Performance Monitoring
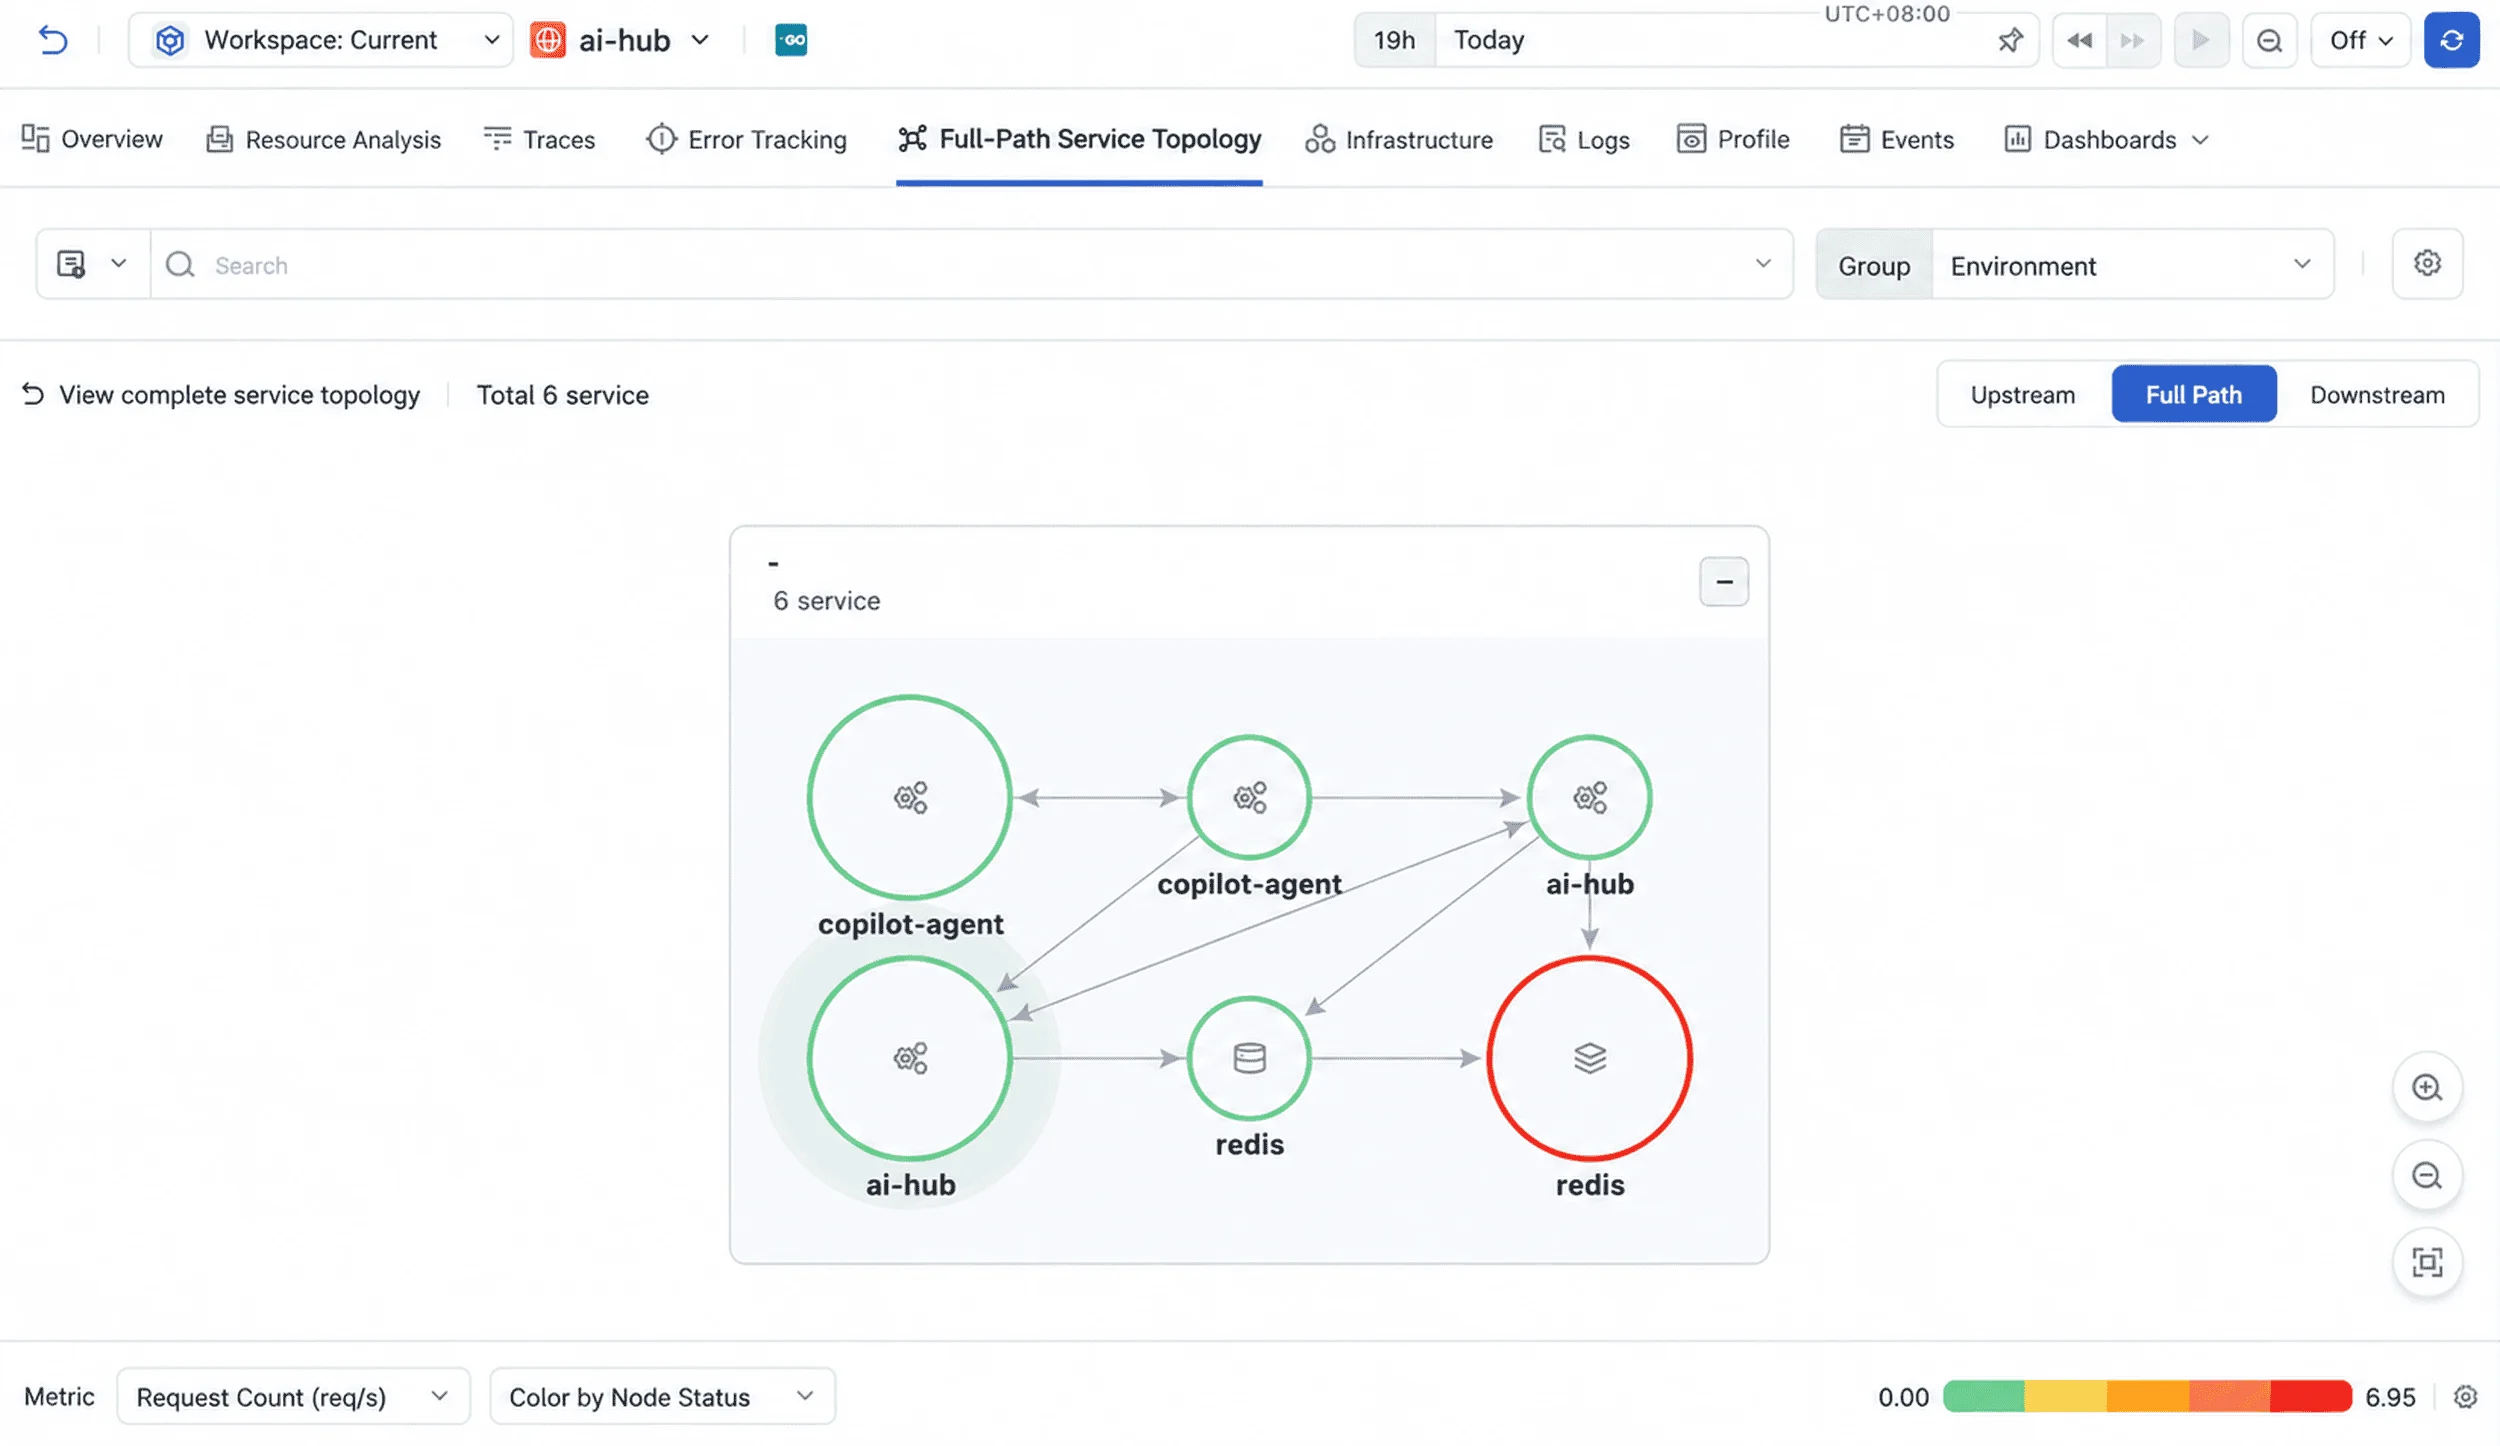
Grouping in the full-path service topology
The full-path service topology on the service detail page adds grouping, so service call relationships can be viewed and analyzed by group.
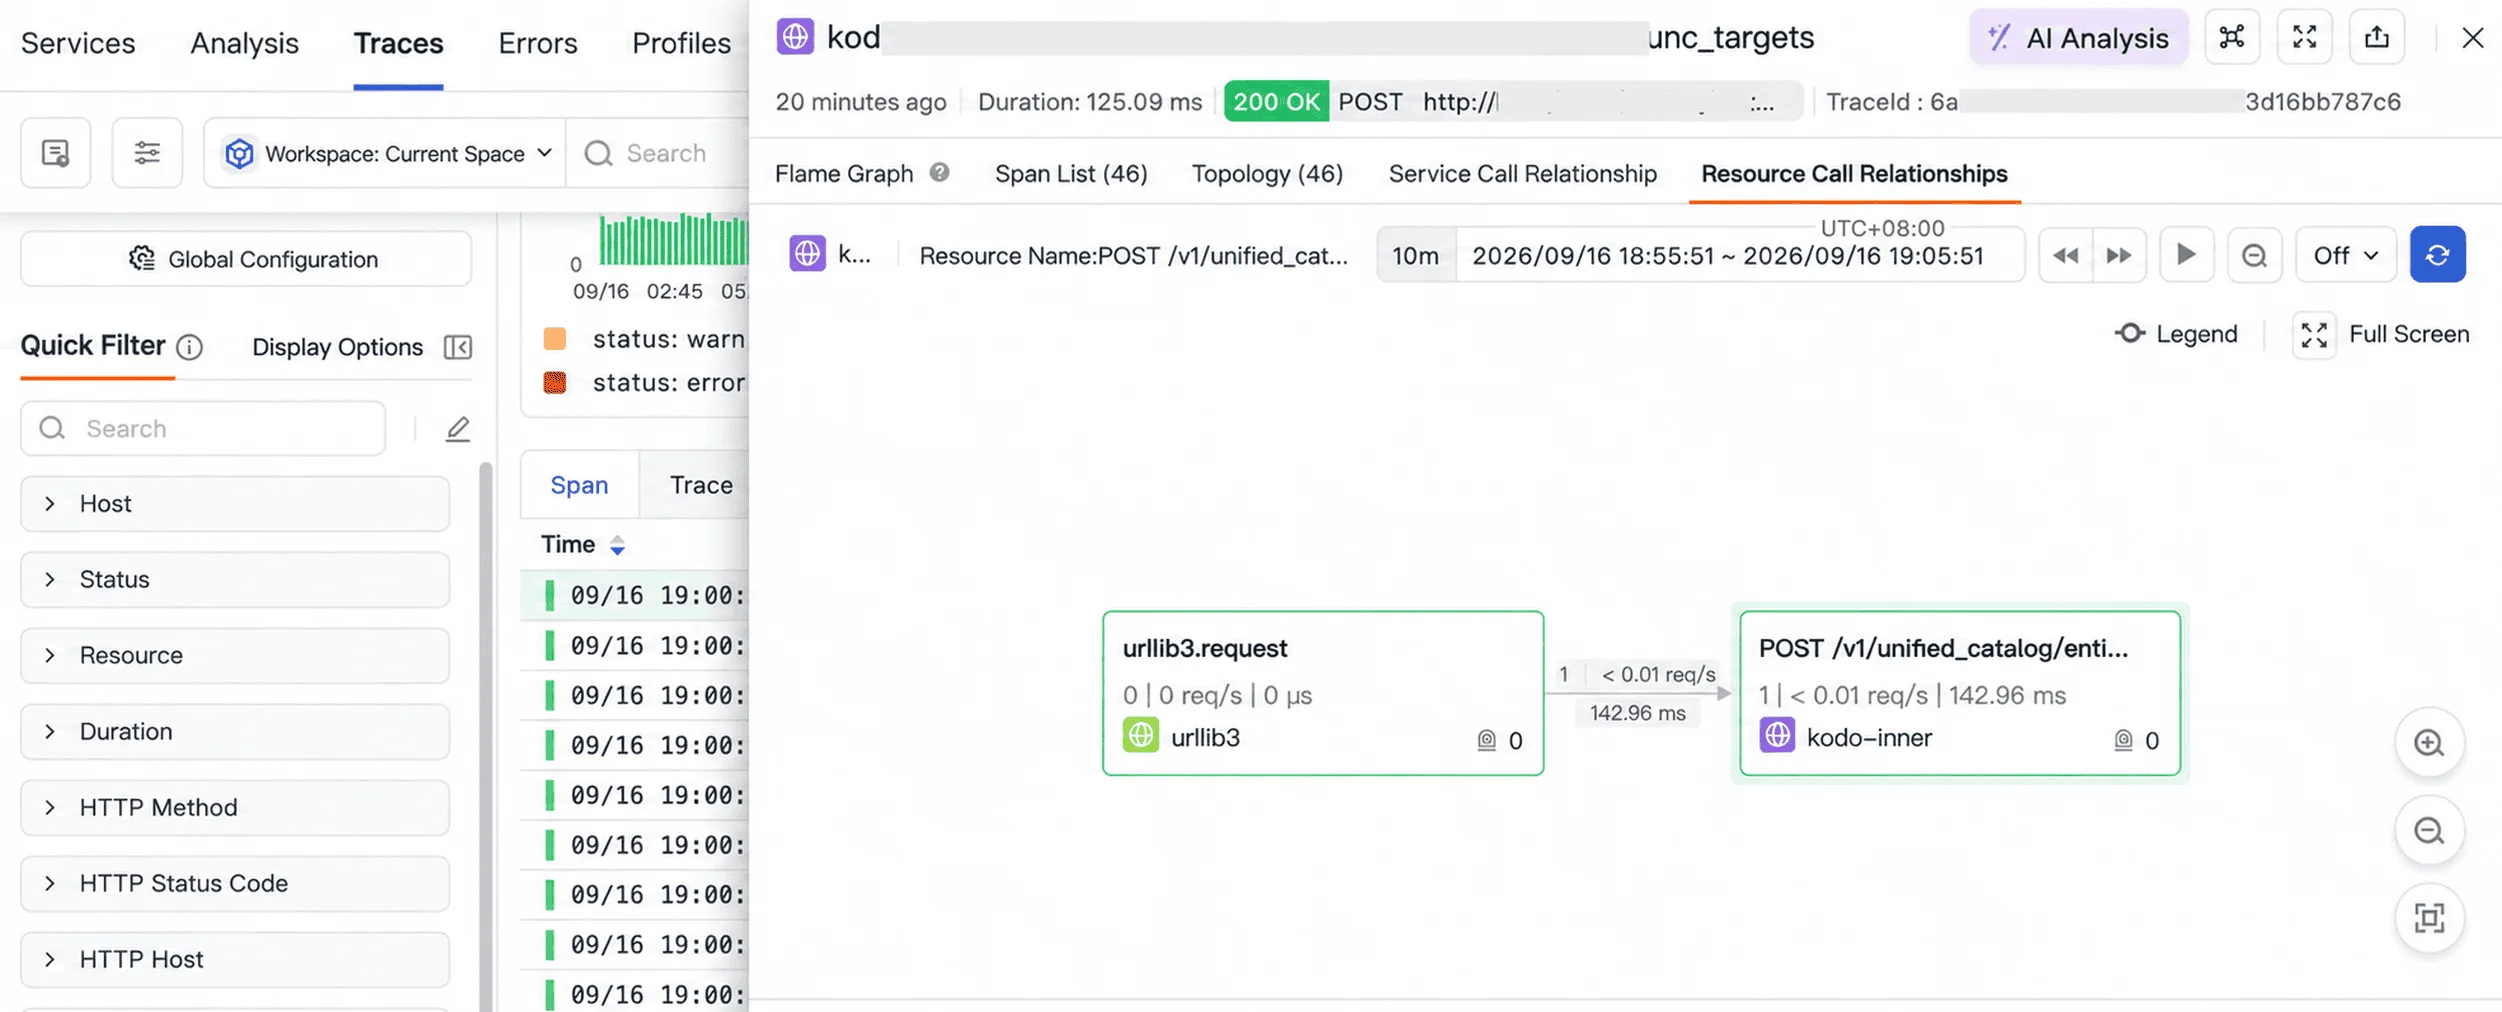
Resource call relationships in trace details
Trace details can be centered on the resource behind a selected span to show upstream and downstream resource call relationships. The view queries 5 minutes before and after the span start time by default, with adjustable time range, refresh, and full-screen viewing, which makes resource dependencies easier to analyze without leaving the trace.
User Access Monitoring
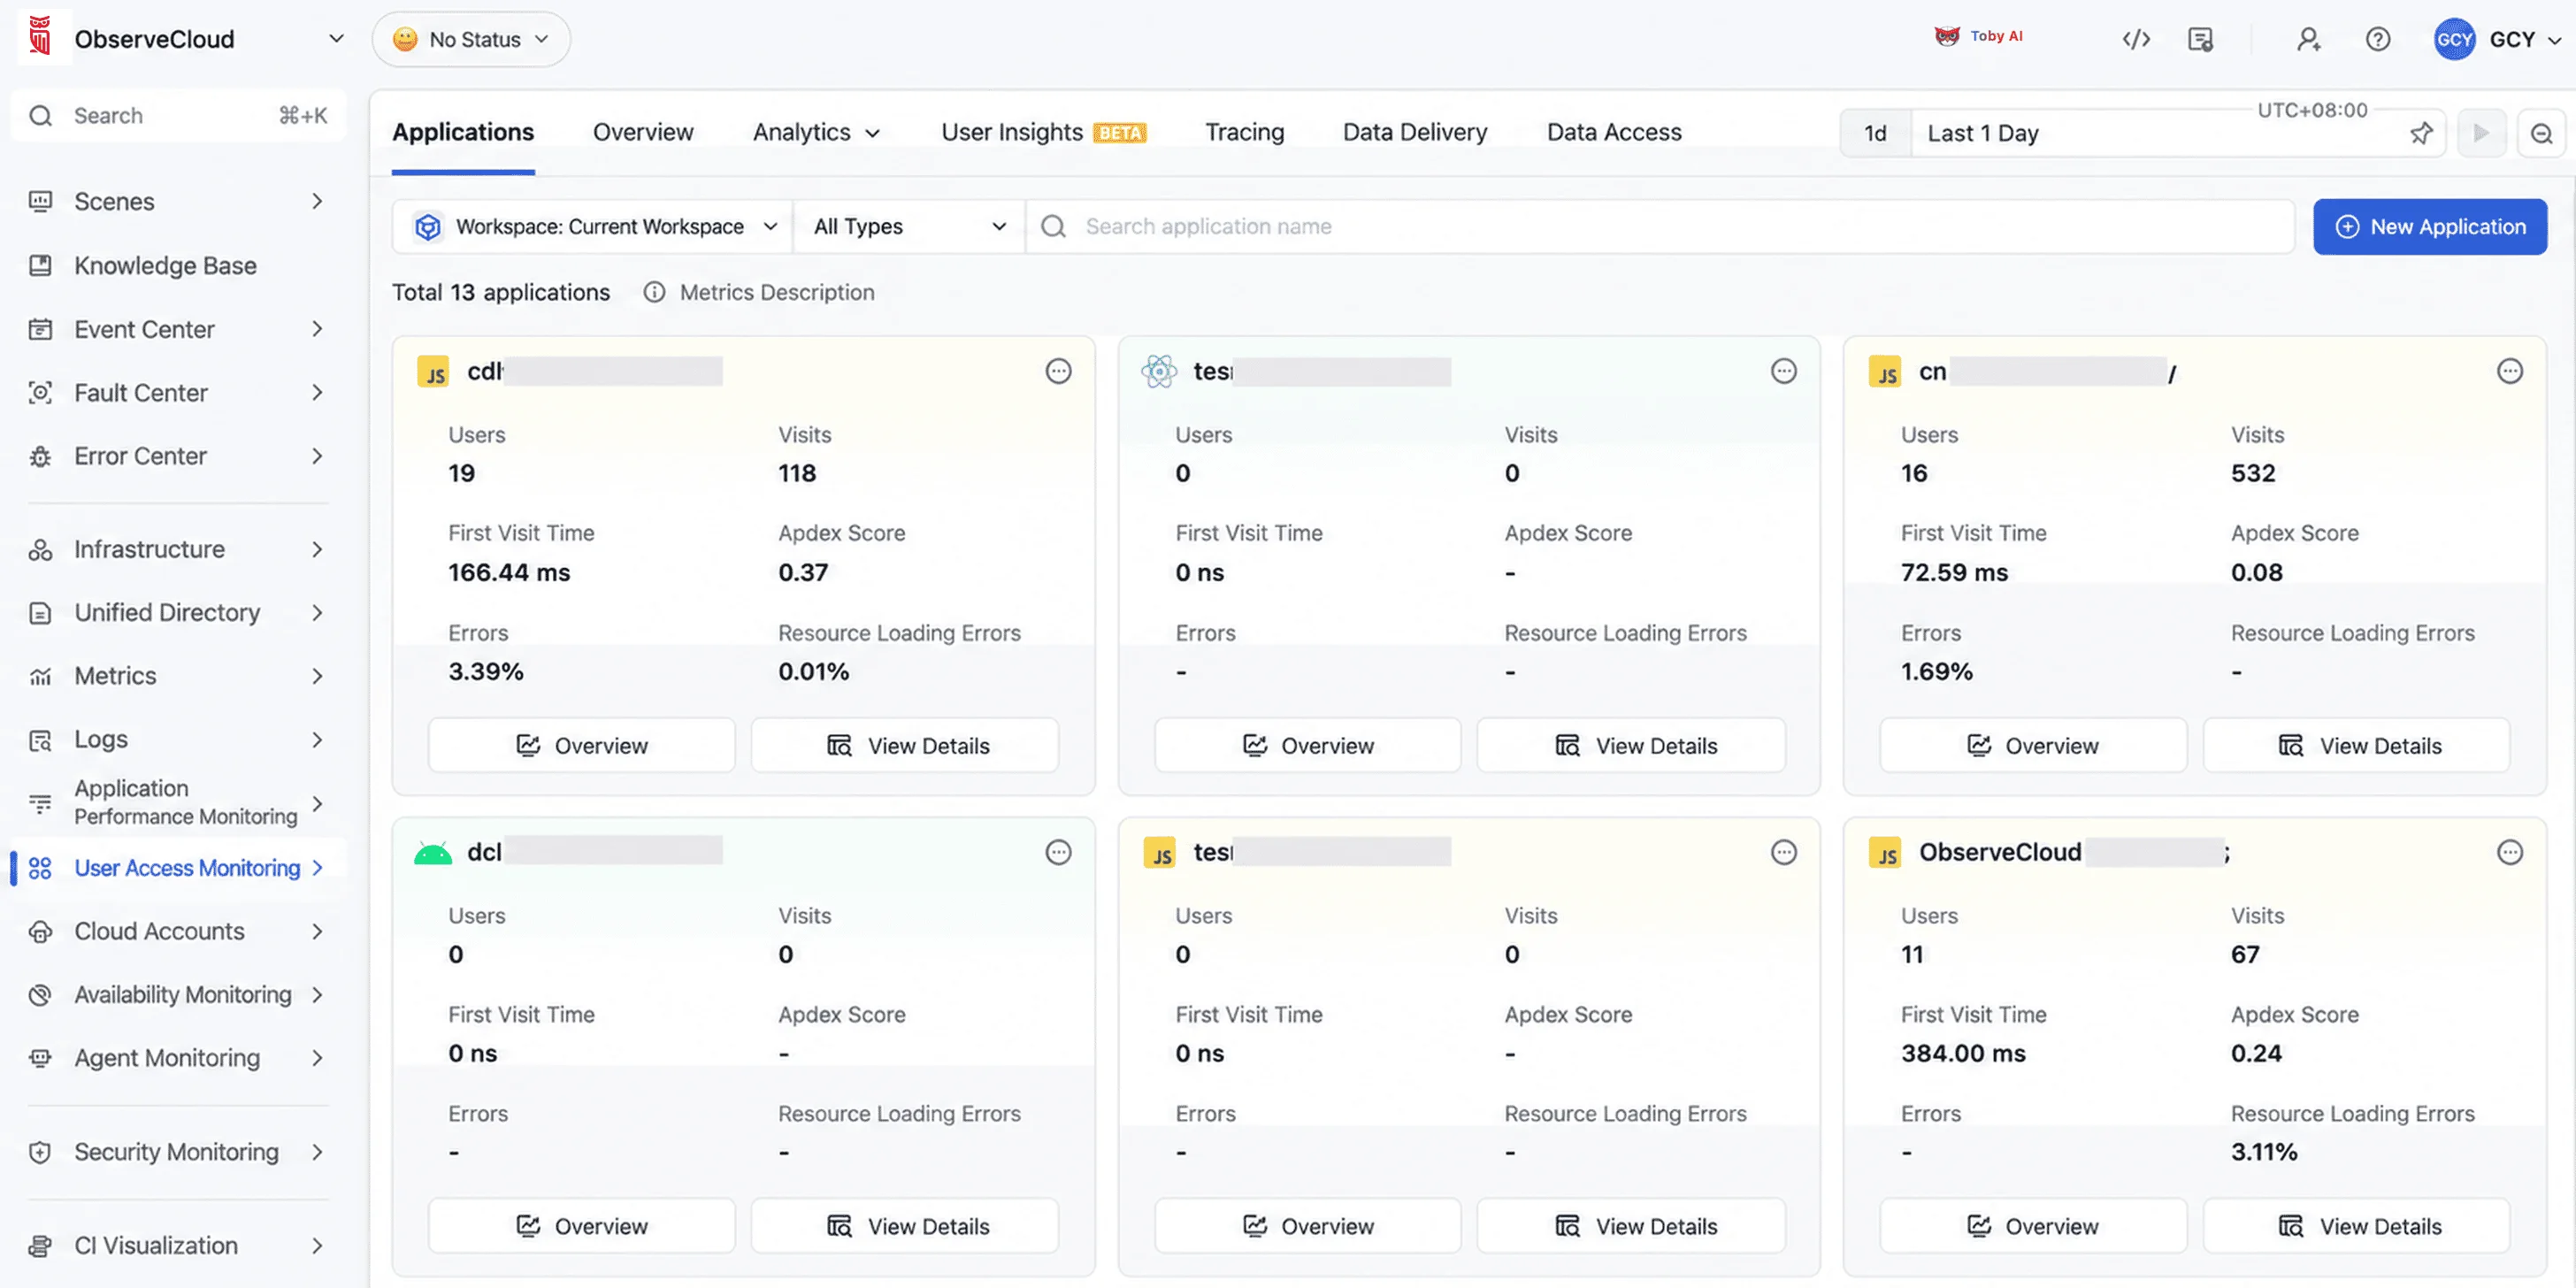
Card layout for the application list
The User Access Monitoring application list moves to a card layout, making application information faster to scan.
Logs
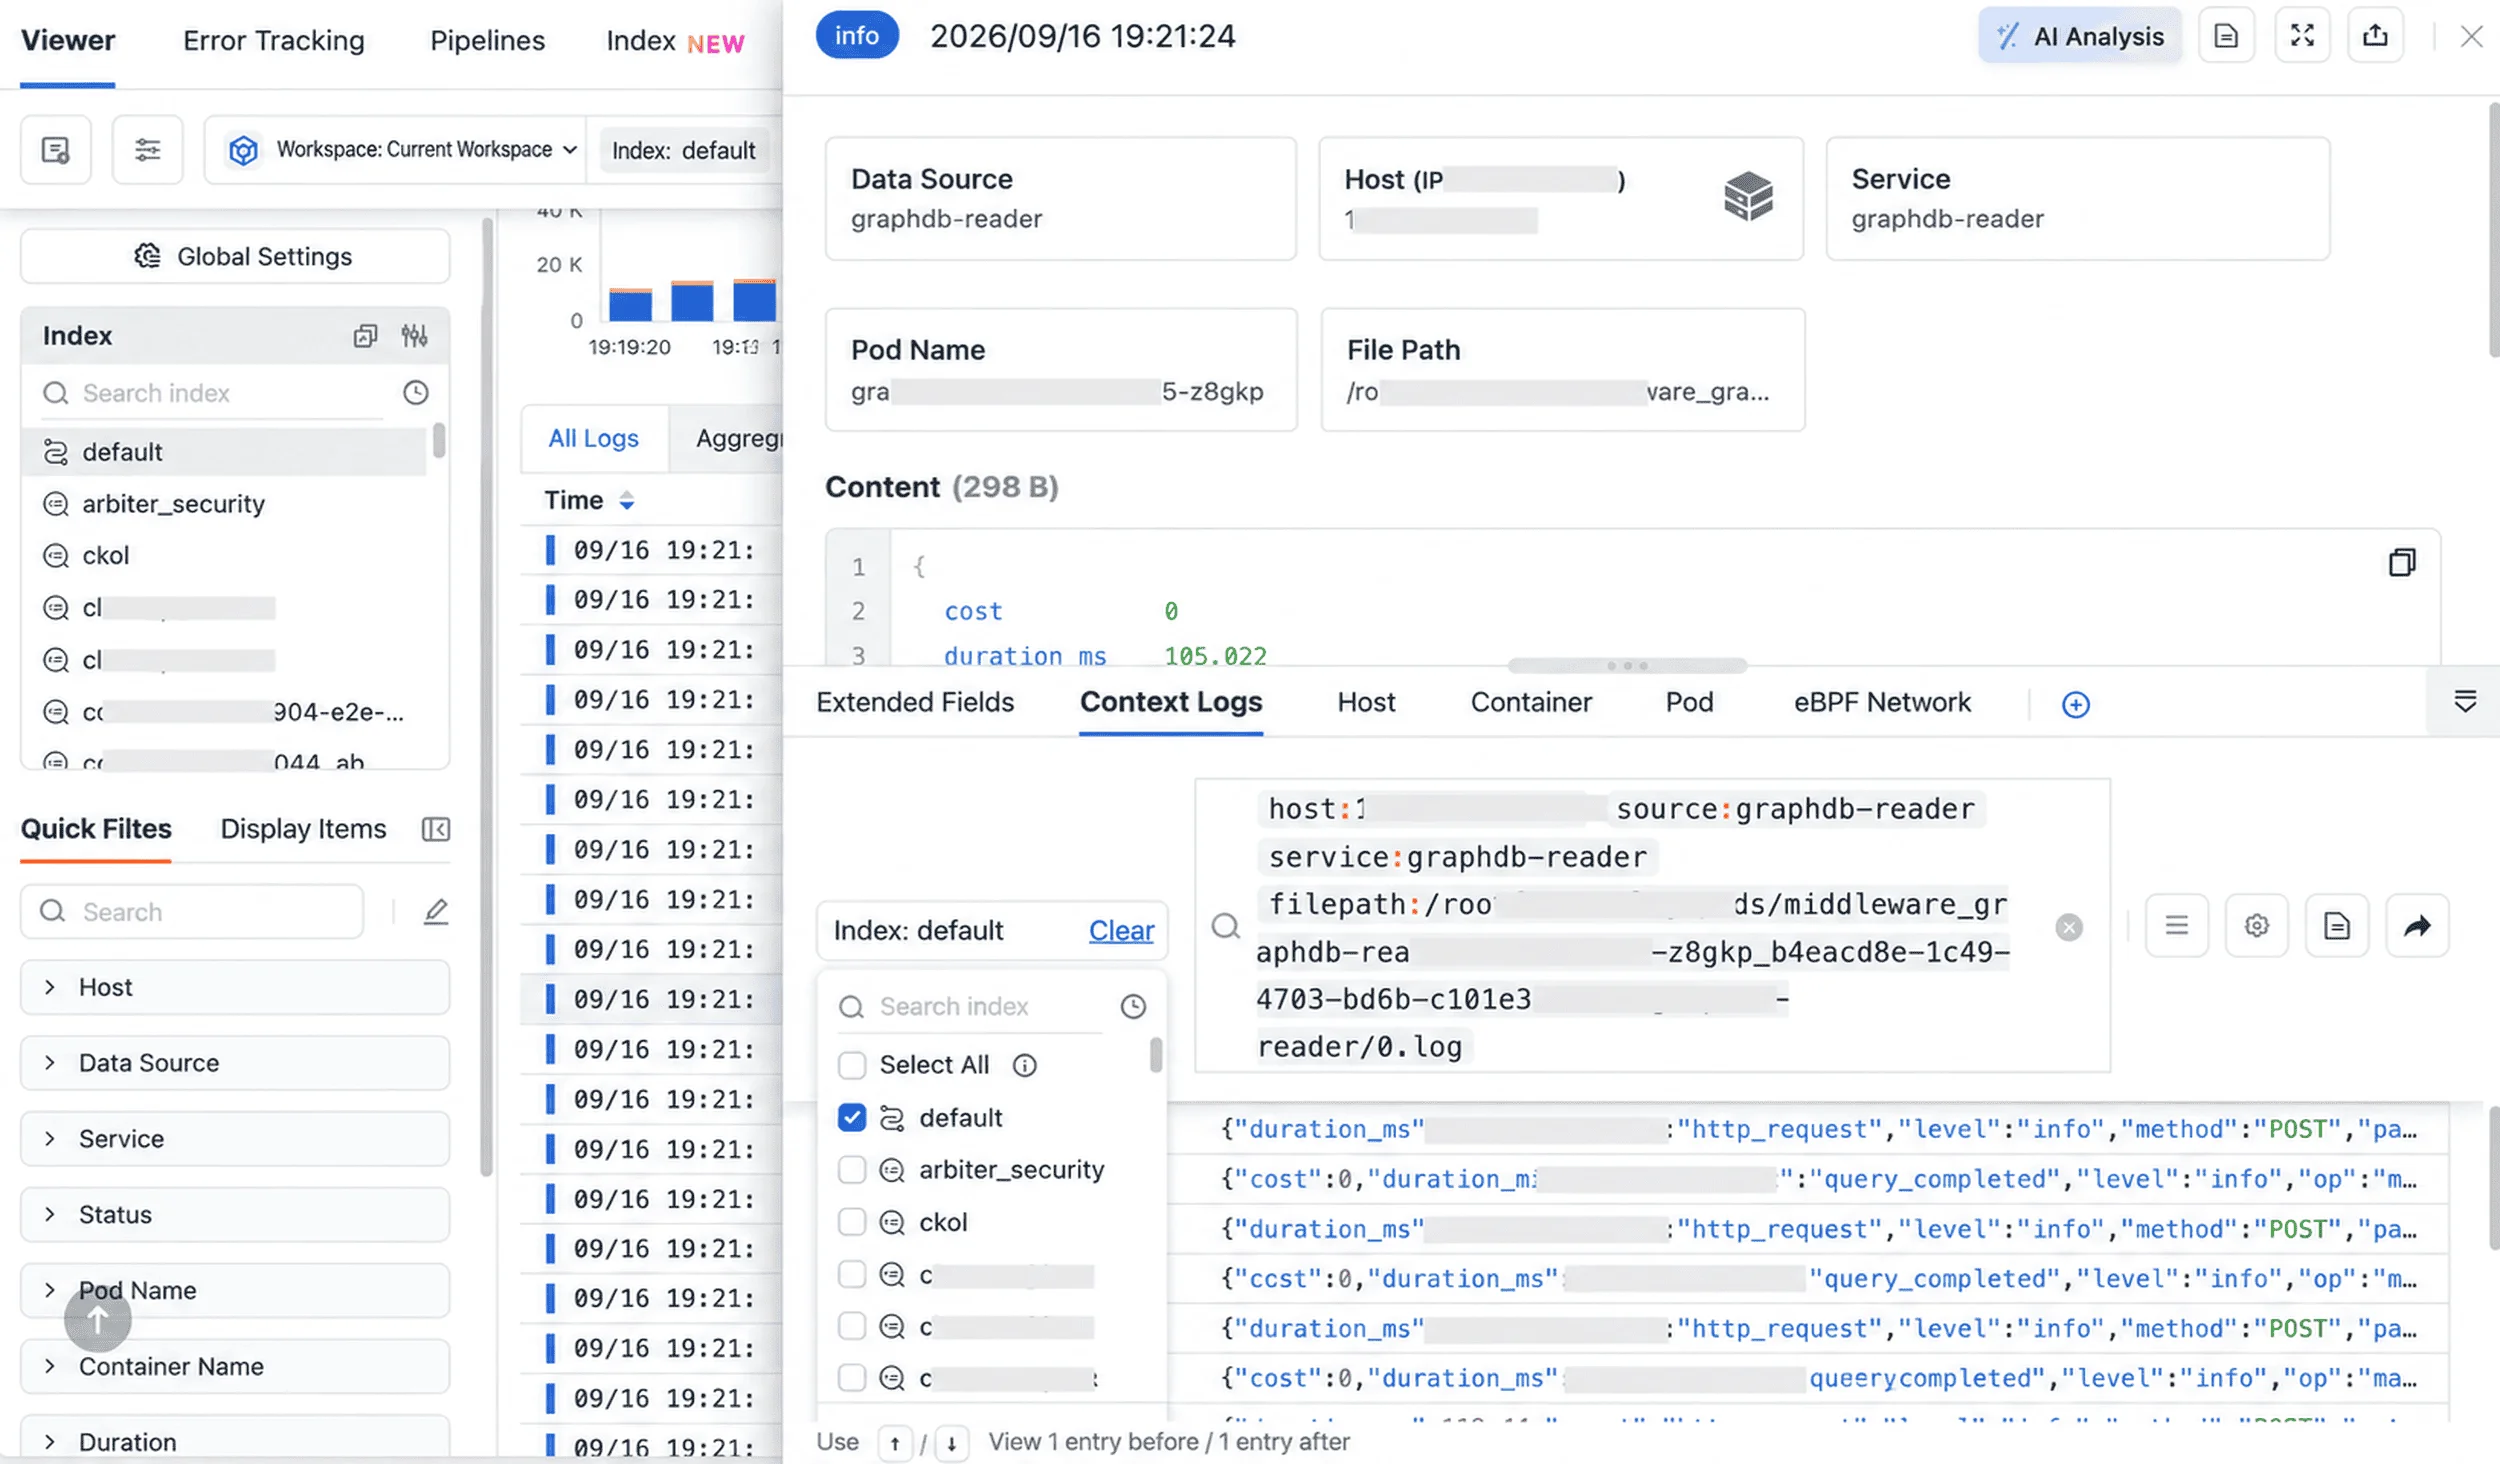
Select every queryable index in context logs
You can select every index you have permission to query in one click, which reduces the chance of missing data during a cross-index investigation.
Key Fields renamed to Display Items
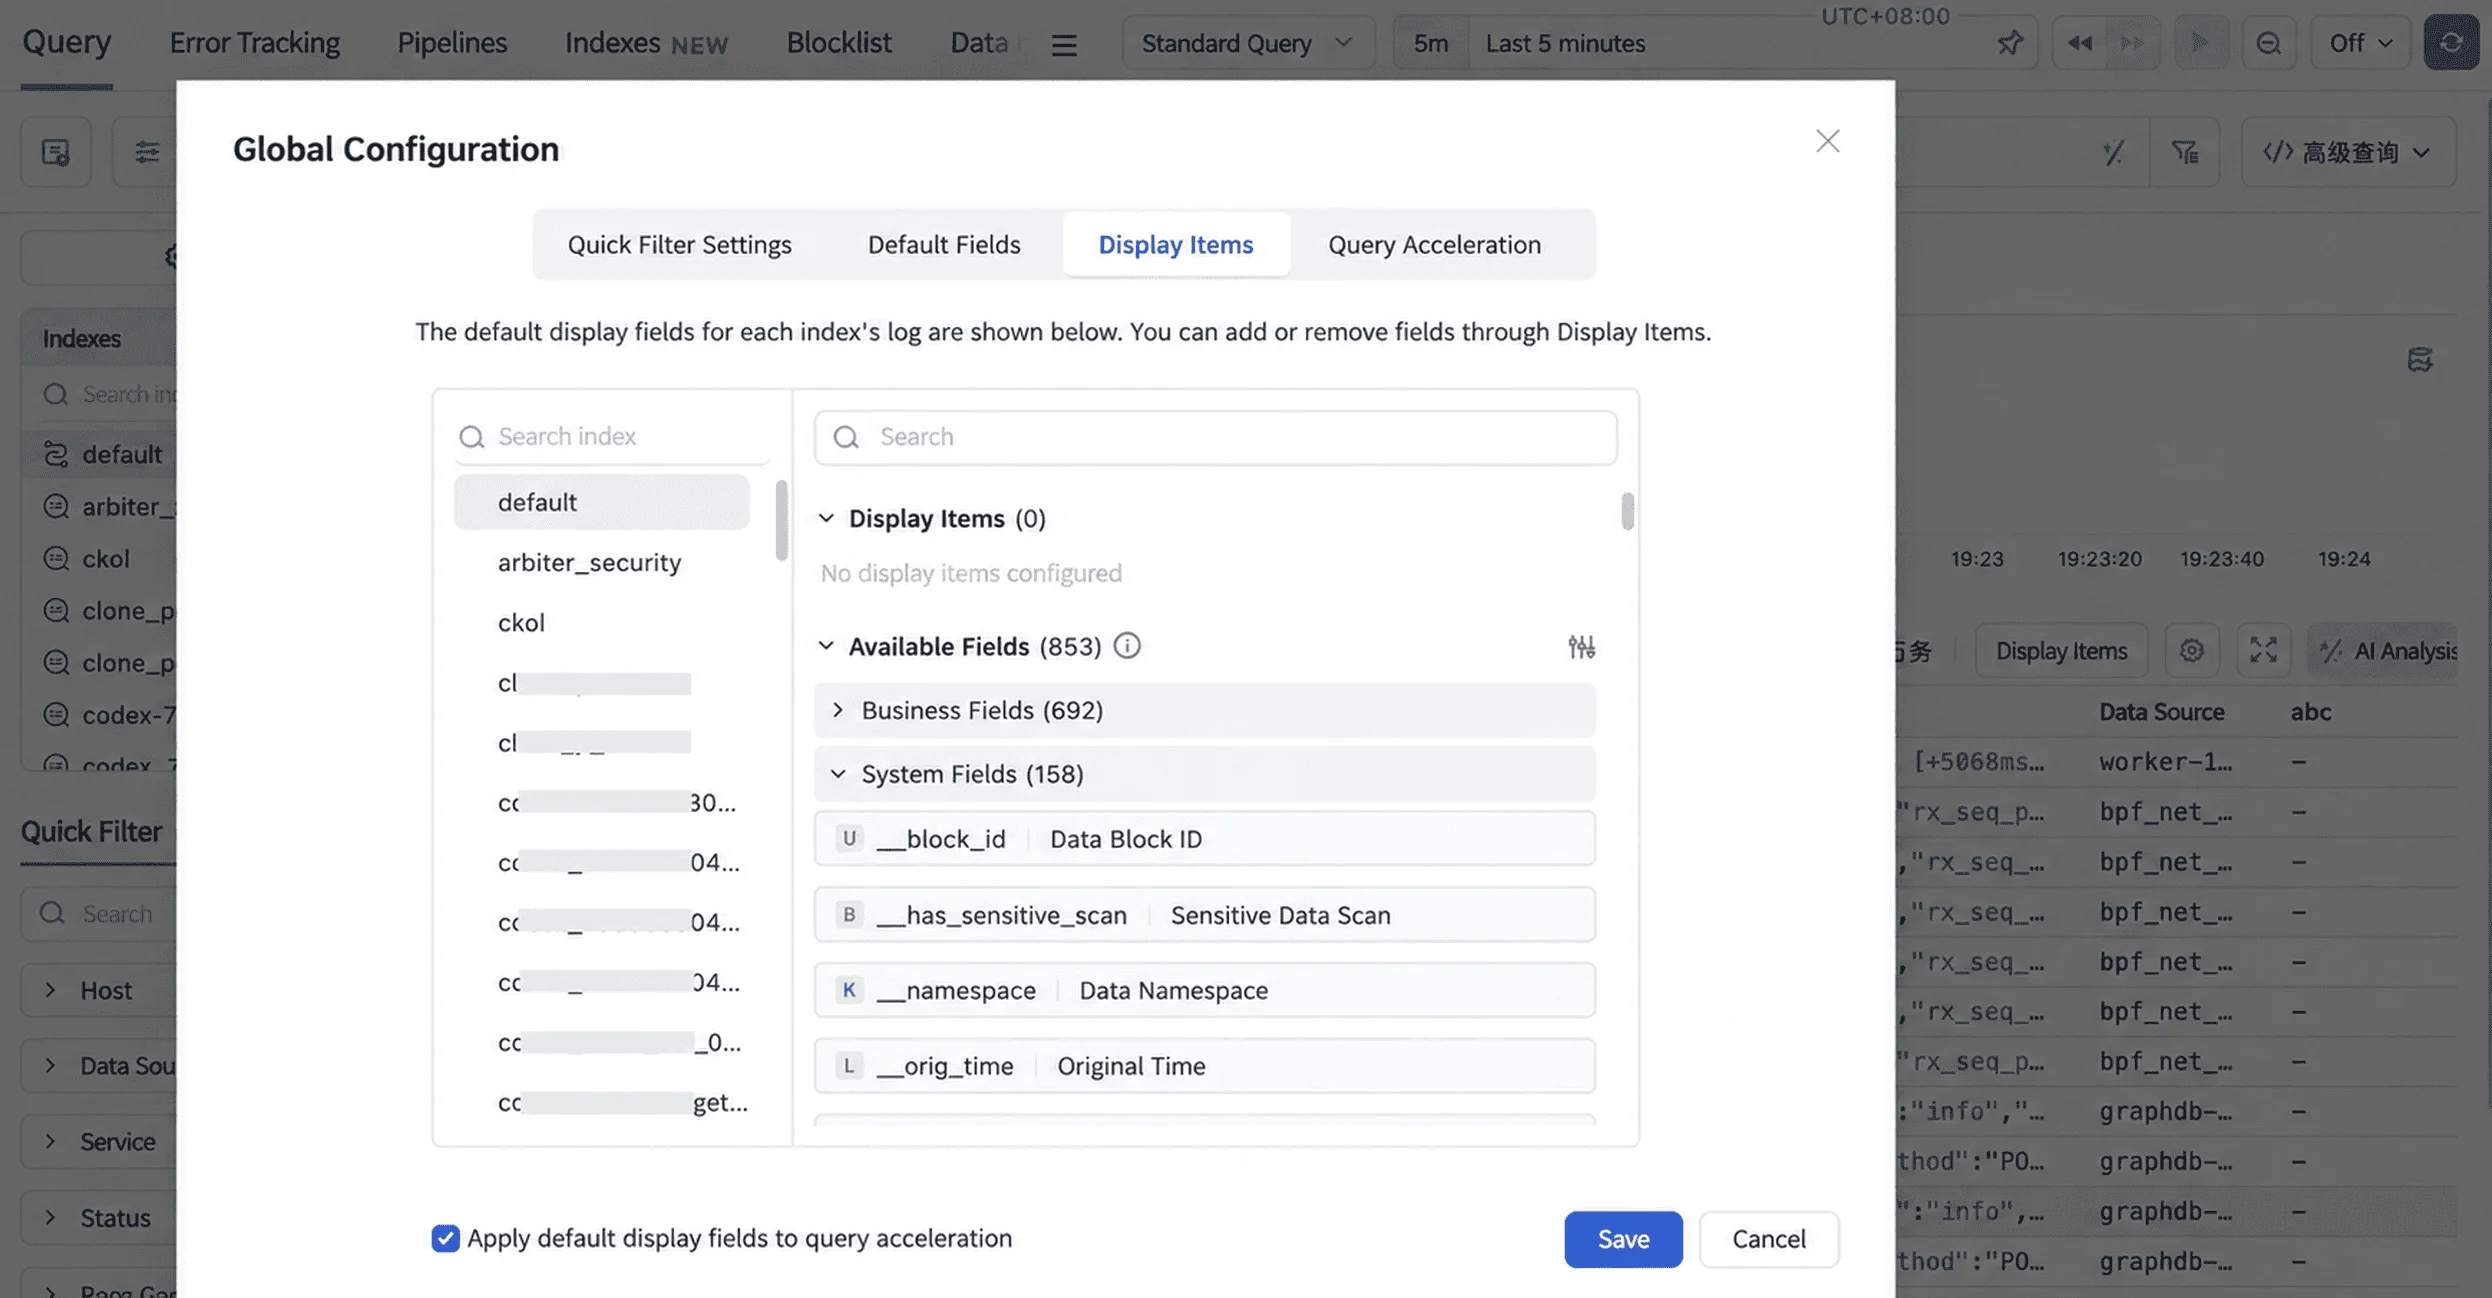
Key Fields in the global log configuration is renamed to Display Items, so the setting name matches what it actually controls.
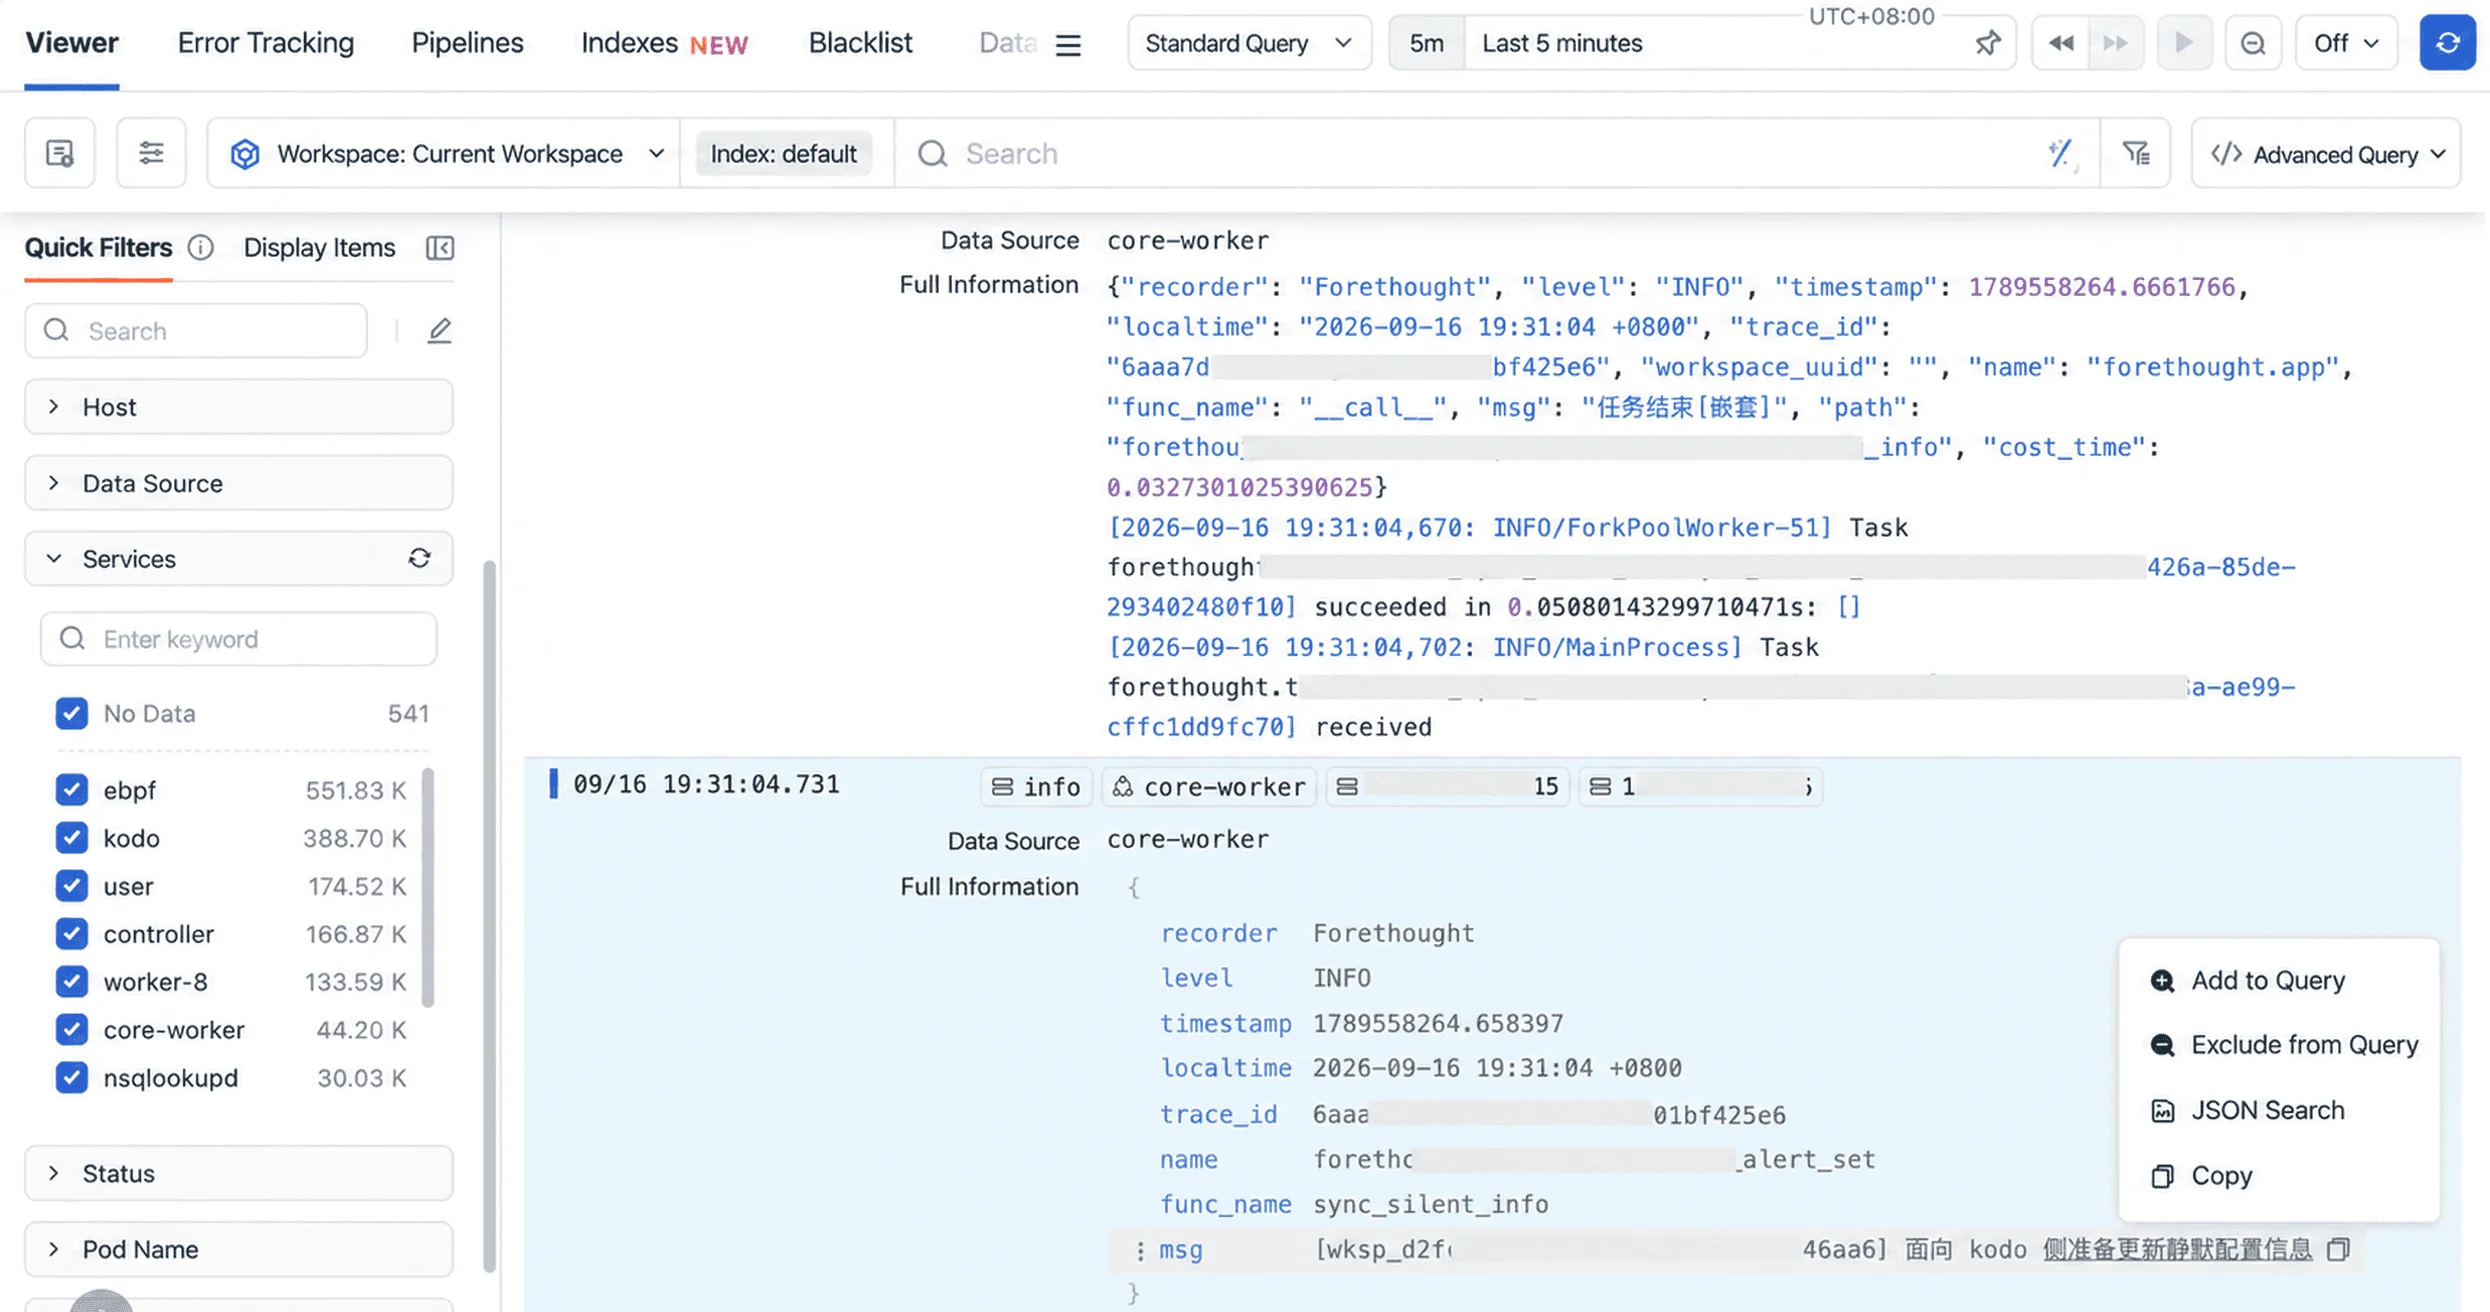
No Data quick filter pinned to the top
The No Data option in the explorer quick filter field list is pinned to the top and separated from the other fields, so it stays reachable while the list scrolls.
Better word selection for mixed-language logs
Log fragments that mix Chinese and English can be selected and added to the search from the context menu. Plain text splits on whitespace and common punctuation, while identifiers, paths, IP addresses, timestamps, and URLs are recognized by their own rules.
Integrations
- New OpenTelemetry SDK onboarding documentation for Ruby, Rust, and C++.
- New agent onboarding support for WorkBuddy, CodeBuddy, OMP, and DCode.
- New observability best practices for Deep Agents, LangChain, and LangSmith.
- New cloud collector templates for Tencent Cloud KeewiDB, TKE, MariaDB, and Memcached.
- New AWS Aurora DSQL collector.
- New OpenRouter LLM and BYOK cost dashboards.
DataKit
New features
- DDTrace adds a
tracing_metrics.qpsmetric that counts received HTTP spans per second, supports custom grouping tags, and is disabled by default.
Bug fixes
- Fixed foreign key and index query errors on SQL Server 2016 and earlier, restoring table schema collection.
- Fixed a timezone mismatch between the database and DataKit that prevented the Oracle slow SQL time cursor from advancing, which caused repeated collection.
- Fixed a multi-statement execution risk in PostgreSQL execution plan collection, and improved recognition of parameterized SQL.
- Fixed synthetic test SSE long connections that were not cancelled on the exit signal, which caused service stop timeouts, and added support for restarting the systemd service from a failed state.
- Fixed macOS ARM hosts installing the amd64 DataKit, and added native arm64 install packages with install and upgrade support.
Improvements
- Added packet and point metrics for tail sampling that falls back to the primary DataWay after a send failure.
FAQ
What is in the TrueWatch September 16, 2026 release?
The release adds streaming output and remote code search to Toby AI Agents, AI semantic monitors, forecasted budget overrun alerts, an incident statistics chart, topology drill-down in Unified Catalog, resource call relationships in trace details, longer metric retention tiers, and a set of integration and DataKit updates.
How do AI semantic monitors differ from smart monitors?
An AI semantic monitor takes a natural language description of what to detect and has the AI analyze observability data on a schedule to generate anomaly events. Smart monitors still use detection rules, but the new AI smart monitor type can generate those rules from natural language, and other types load built-in defaults you can adjust.
What changed for cloud cost control?
Budget rules can forecast an overrun before it happens, alerting when end-of-period spend is projected to reach 90% of budget or when the budget is expected to be exceeded within 7 days, with the forecast recalculated daily and surfaced in the budget list, detail page, and analysis overview.
Does this release change how metrics are billed?
Yes, for new cost center accounts. Cost center accounts created after this release bill their paid workspaces by data points by default, while existing accounts and the workspaces bound to them keep their current billing method.
