
If you are evaluating an ELK stack alternative, the real question is not which tool can store logs. Both the ELK stack and TrueWatch can collect, search, and visualize log data. The difference is how much of the surrounding work your team has to run itself, and whether logs stay connected to metrics, traces, user sessions, and infrastructure when an incident crosses service boundaries.
Logs are usually the first place engineers go when something breaks. A failed checkout, a slow API, an unexpected container restart, a suspicious login, a database timeout: each of these leaves a trail somewhere in the system. The challenge is turning that trail into an investigation path quickly enough.
The ELK stack, now usually called the Elastic Stack, has long been a common way to set up centralized logging, search, and visualization. It is flexible, familiar, and effective for teams that know how to operate Elasticsearch. TrueWatch approaches log monitoring from a different angle: logs are one signal inside a broader observability workflow that also includes metrics, traces, real user monitoring (RUM), events, infrastructure, cloud resources, dashboards, alerts, and AI-assisted investigation.
This guide compares the two across data collection, storage, query, visualization, and cost, so you can decide which operating model fits your team.
Short Answer: When the ELK Stack Fits, and When TrueWatch Is the Better ELK Stack Alternative
The ELK stack is a strong fit when your team wants deep control over Elasticsearch-based search and analytics, has the engineering capacity to operate the stack, and mainly needs log search, indexing, and visualization.
TrueWatch is a stronger fit when the team wants logs connected to full-stack observability from day one. That usually matters when incidents cross service boundaries: a frontend error leads to an API trace, the trace leads to a database query, the query leads to a host metric, the host metric leads to a Kubernetes event, and all of it needs to tie back to an alert, owner, dashboard, or incident workflow.
The question is less about whether each side can collect logs. Both can. It is about how much of the end-to-end operating model the platform takes on for you.
What the ELK Stack Provides
ELK originally referred to Elasticsearch, Logstash, and Kibana. Beats later became an important part of the ecosystem, and Elastic now describes the Elastic Stack more broadly as Elasticsearch, Kibana, Elastic Agent, Logstash, and related components that work together to ingest, store, search, and visualize data at scale.
In that architecture:
- Elasticsearch is the distributed search and analytics engine.
- Logstash collects, transforms, enriches, and routes data.
- Kibana provides the interface for exploration, dashboards, visualization, and analytics.
- Beats and Elastic Agent collect data from hosts, services, logs, metrics, and other sources.
Elastic has also invested in Elastic Agent and Fleet, which offer a more unified way to manage integrations and policies than a purely Beats-based deployment. Older ELK discussions often overstate the "many agents" problem, and in current Elastic deployments Elastic Agent reduces part of that complexity.
The tradeoff is that teams still need to plan carefully for Elasticsearch capacity, index design, retention, ingestion pipelines, mappings, shard behavior, permissions, upgrades, and cloud or self-managed cost.
What TrueWatch Provides
TrueWatch is an observability platform for engineering, operations, testing, security, and business teams. It brings logs, metrics, traces, RUM, synthetic tests, infrastructure data, cloud resources, alerts, dashboards, security events, and incident workflows into one production context.
That matters during real troubleshooting. A log entry that says timeout is more useful when the same platform can also show the affected service, related trace, upstream request, downstream dependency, host status, container restart, deployment event, user session, alert policy, and owner.
TrueWatch is built around three operational ideas:
- Unified collection: DataKit collects multiple signal types through one agent with multiple inputs, while SDKs and integrations cover RUM, APM, cloud services, middleware, and application frameworks.
- Unified query and analysis: DQL provides one query layer across logs, metrics, traces, RUM, objects, events, and other observability data. PromQL compatibility lets teams keep existing metric-query habits where needed.
- Unified operating context: Dashboards, scenes, alerts, incidents, resource topology, and AI-assisted workflows are designed around production investigation rather than standalone log search.
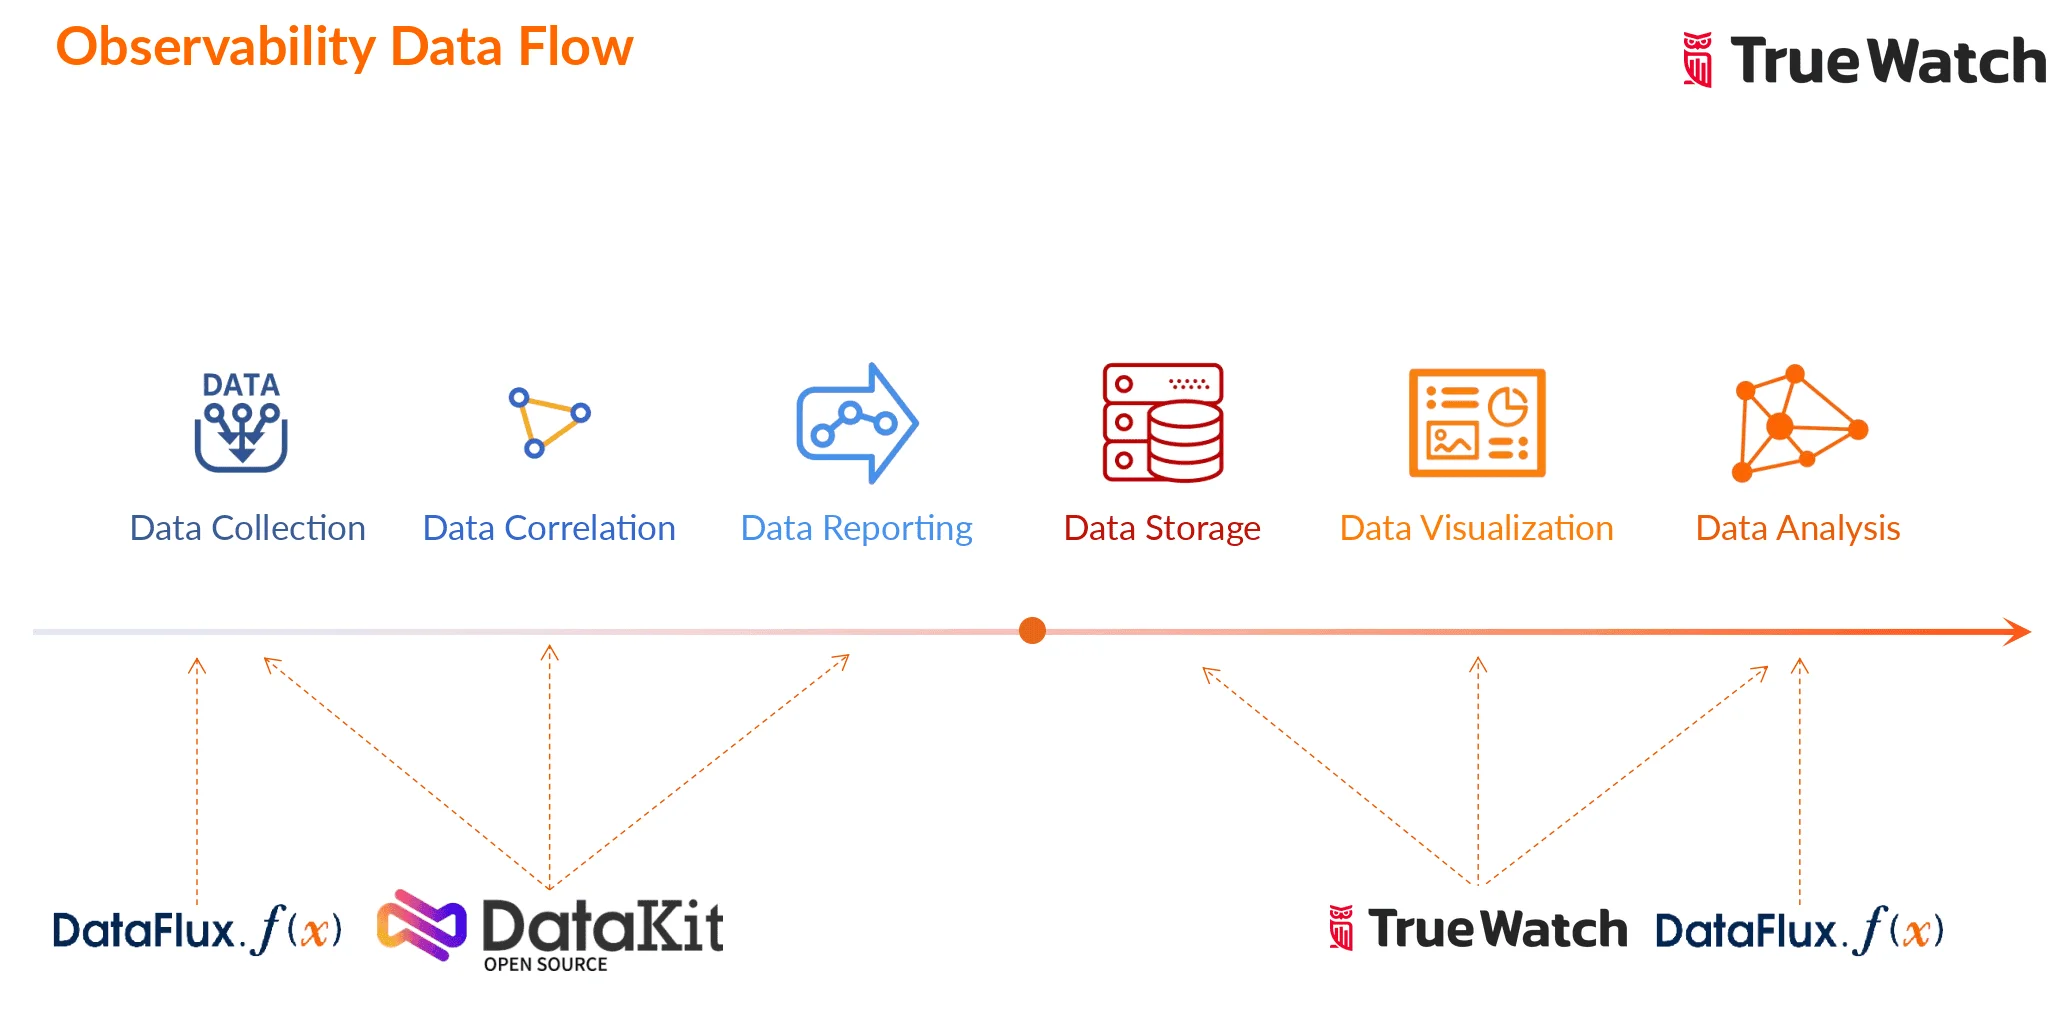
Data Collection: Pipeline Flexibility vs Operational Simplicity
Elastic gives teams several ways to collect and ship data. Beats can send data directly to Elasticsearch or through Logstash. Elastic Agent provides a unified path for logs, metrics, and other host data, while Fleet manages policies centrally. This ecosystem is mature and flexible, especially for teams that already understand Elastic pipelines.
The cost of that flexibility is operational design. Teams still need to decide which collection path to use, how to parse and enrich data, where transformations should happen, how to handle back pressure, and how policies are managed across environments. Teams looking for a Logstash alternative are often trying to reduce exactly this design work.
TrueWatch takes an observability-platform-first approach. DataKit is a unified data collection agent with multiple inputs. Instead of treating logs, metrics, host data, traces, and infrastructure signals as separate ingestion projects, teams enable the inputs they need and connect them in the same platform context.
This does not mean every signal is collected by the same binary in every situation. RUM still requires frontend or mobile SDKs, and application tracing may use OpenTelemetry or language-specific instrumentation. The point is that TrueWatch reduces the number of operational surfaces a team has to stitch together before it can investigate across signal types.
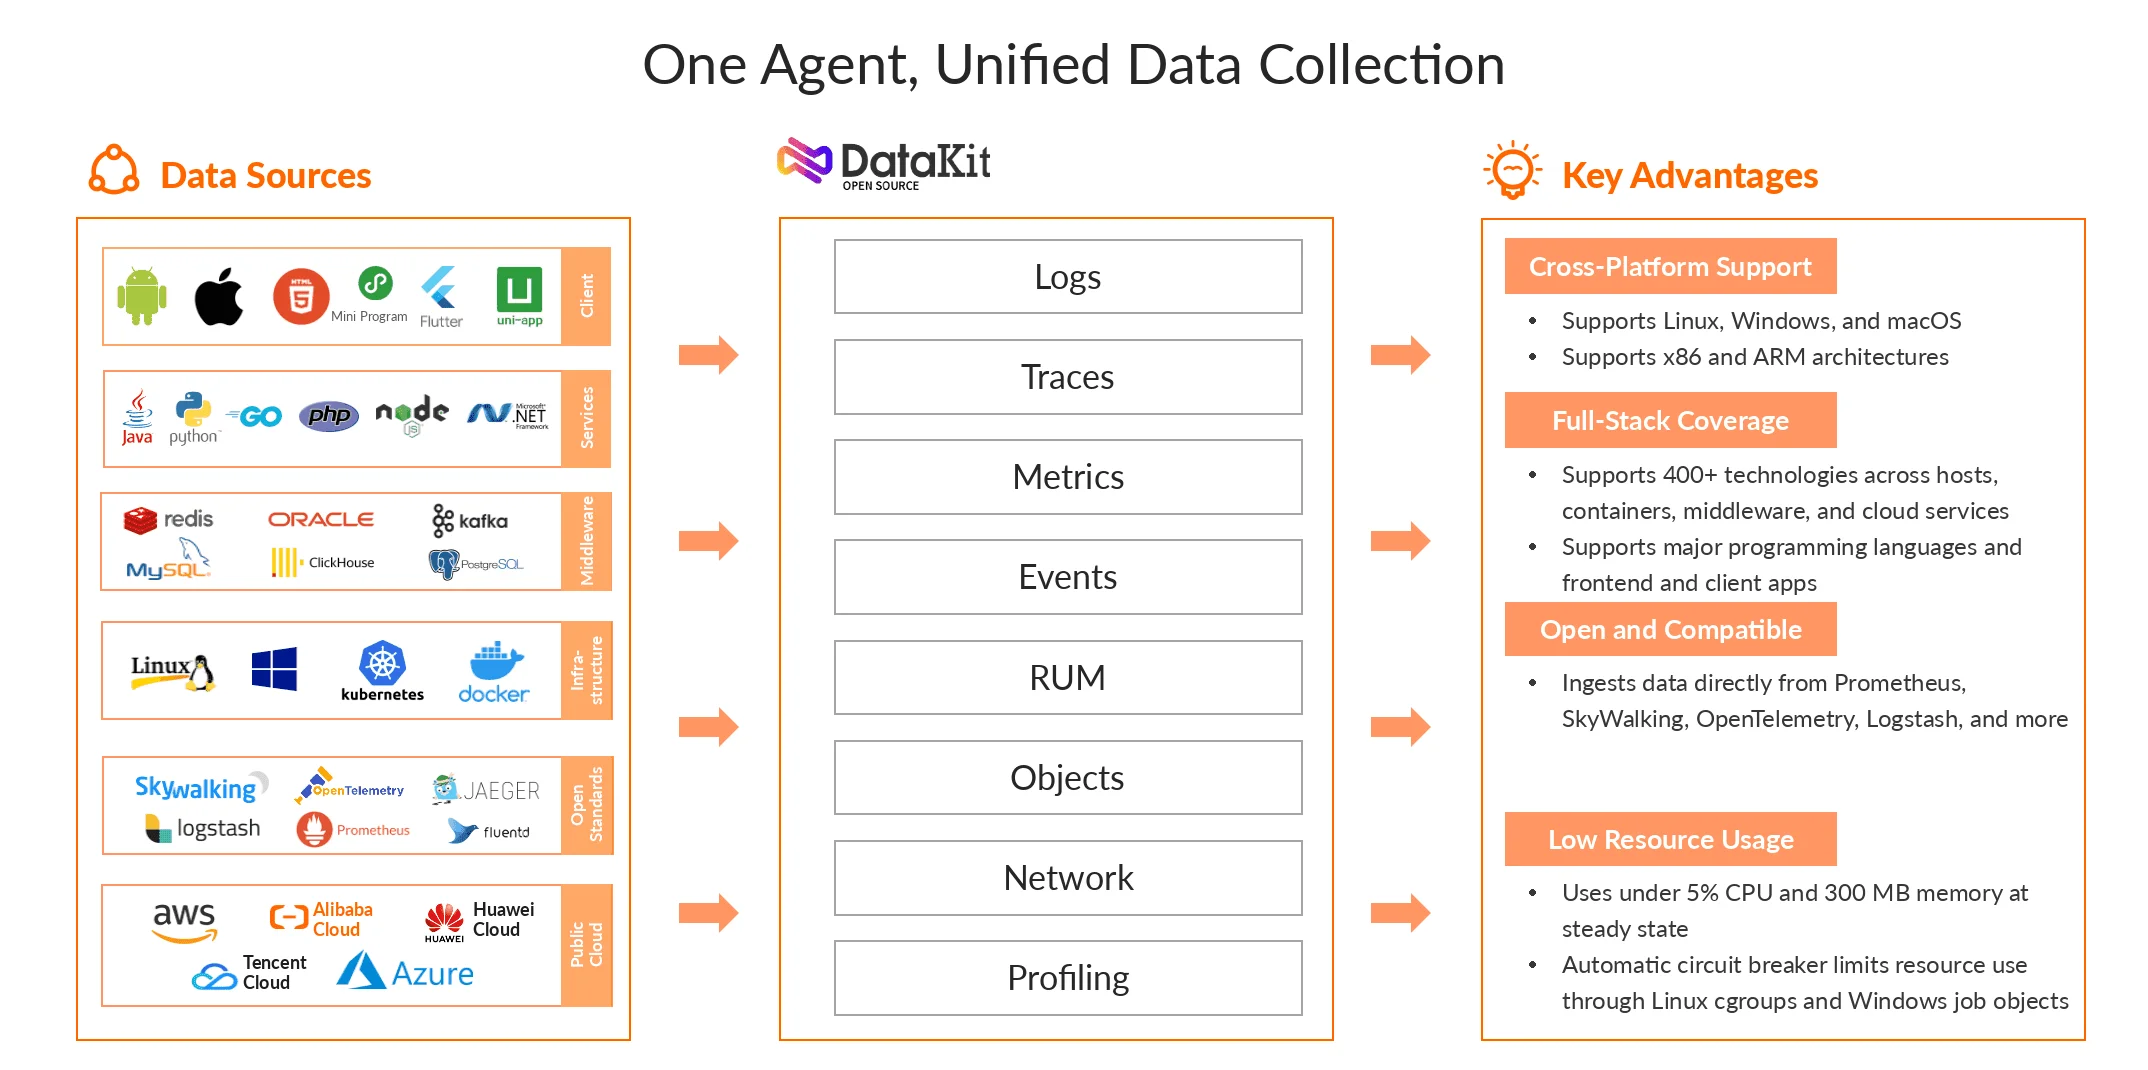
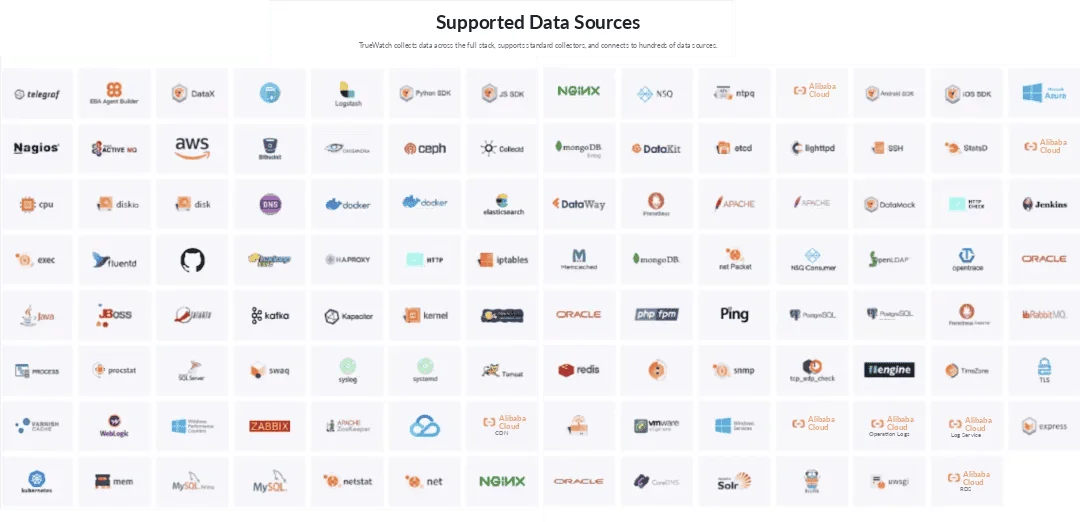
For teams with small logging needs, either approach can work. For teams running Kubernetes, microservices, cloud resources, user-facing applications, and multiple middleware layers, the collection question becomes broader: can your platform keep the signals connected after they are ingested?
Data Storage: Search Engine Control vs Observability Storage Design
Elasticsearch is the core of the ELK stack. It is built for distributed search and analytics, using inverted indexes, analyzers, distributed nodes, shards, and replicas to search large datasets efficiently.
That design is one reason the ELK stack became so widely adopted for log analytics. It also means running Elasticsearch well requires real expertise. Index lifecycle management, shard sizing, hot, warm, and cold storage tiers, mapping choices, query behavior, memory pressure, and cluster scaling all affect both performance and cost.
TrueWatch uses an observability-oriented storage architecture designed for schemaless ingestion, flexible fields, distributed storage, high availability, and large-scale signal analysis. Instead of asking teams to model every field and operational pattern up front, the storage layer is built around how observability data behaves in practice: fields change, services evolve, tags drift, and new signal types appear during incidents.
The practical difference:
- ELK stack: more direct control over Elasticsearch internals.
- TrueWatch: less storage engineering before logs become useful inside a broader observability workflow.
For teams with deep Elasticsearch expertise, that control can be valuable. For teams evaluating an Elasticsearch alternative to reduce maintenance work, TrueWatch offers a simpler operating model.
Query: Query DSL and KQL vs One Observability Query Layer
Elasticsearch supports a rich Query DSL for search, filtering, aggregation, sorting, pagination, and advanced query logic. Kibana also provides KQL (Kibana Query Language), a simpler language for filtering and exploring data in Kibana.
That separation works for experienced Elastic users, but it can create friction for teams that need to move between logs, metrics, traces, infrastructure objects, and user behavior during a live incident.
TrueWatch uses DQL as a unified query language across observability data. Logs, metrics, traces, resource objects, RUM sessions, events, and other datasets can be queried through one syntax model. For metric-heavy teams, PromQL compatibility preserves existing habits and migration paths.
This is more than a syntax preference. During troubleshooting, switching between query languages slows people down. A unified query layer makes it easier for an SRE, backend engineer, frontend engineer, and operations lead to work from the same evidence instead of translating between tools and data models.
Visualization: Kibana Dashboards vs Investigation-Oriented Views
Kibana is a mature part of the Elastic ecosystem. It provides charts, dashboards, maps, reports, exploration, filters, aggregations, and visual analytics, and it works well for log-centric analysis on Elasticsearch data.
TrueWatch provides dashboards and scenes for logs, metrics, traces, infrastructure, RUM, APM, cloud resources, and incidents. The goal is not only to draw charts but to preserve investigation context. A dashboard should help a team move from a symptom to the affected service, dependency, trace, log line, resource status, and owner.
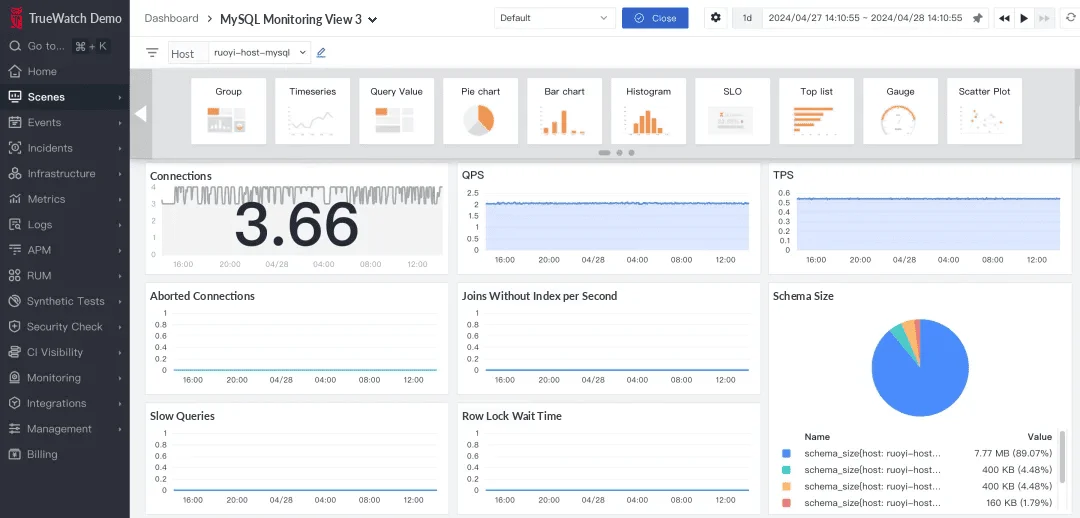
TrueWatch also includes prebuilt views for common domains such as APM, RUM, infrastructure, cloud resources, and middleware. That reduces the work needed to build a useful starting point before the first incident happens.
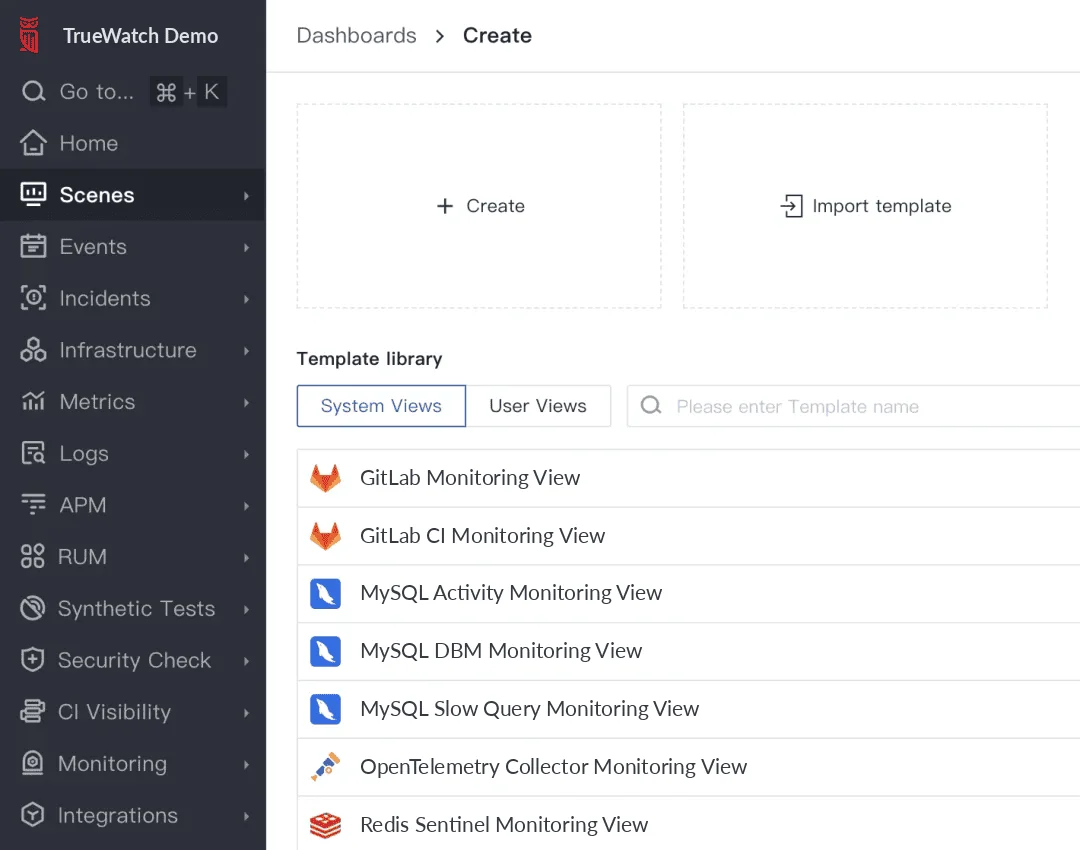
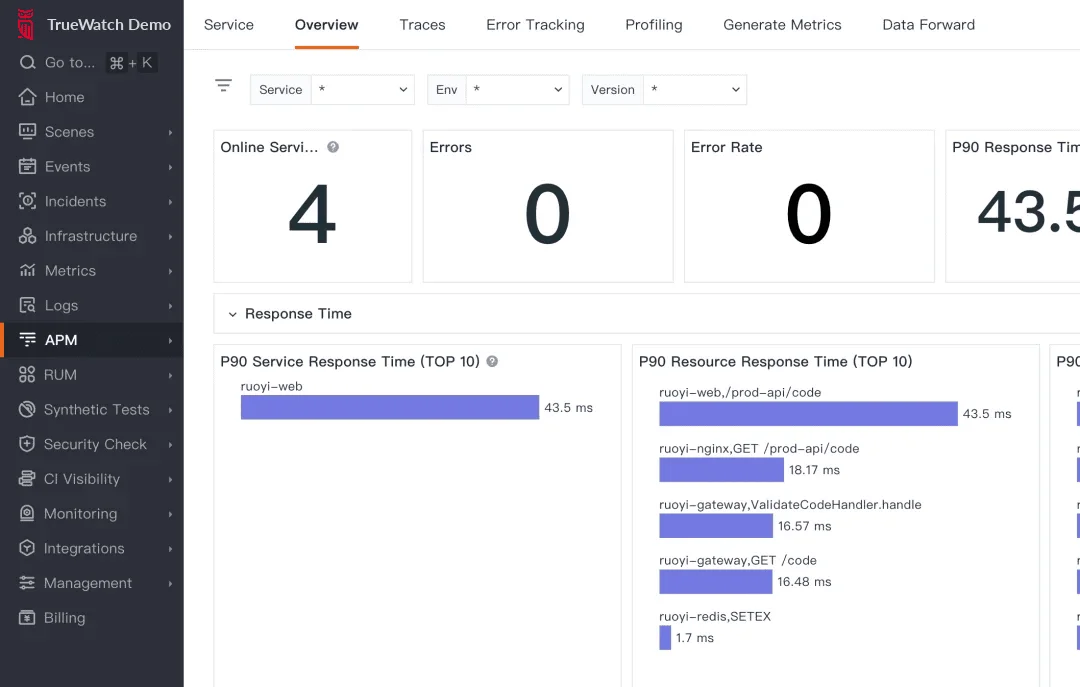
The difference shows up during an incident. A chart is useful. A chart that keeps the service, trace, log, deployment, resource, alert, and user impact connected is more useful.
Cost and Maintenance: License Price Is Only One Part of Total Cost of Ownership
A single monthly price is not a reliable way to compare these platforms. Elastic offers several deployment and pricing paths, including hosted, serverless, and self-managed options, with resource-based pricing and pricing calculators.
The real total cost of ownership depends on:
- Ingestion volume
- Retention period
- Hot, warm, cold, and archived data strategy
- Query load
- Availability requirements
- Elastic feature tier or deployment model
- Storage and compute resources
- Operational labor for self-managed environments
- Upgrade, security, backup, and scaling work
- The number of separate tools needed outside logging
The ELK stack can be cost-effective for teams that already have Elasticsearch expertise and clear log retention patterns. Costs can rise when data volume grows, retention gets longer, queries become heavier, or the team has to dedicate significant engineering time to cluster operations.
TrueWatch offers several adoption paths, including SaaS, dedicated deployment, and private deployment, depending on business and data requirements. The advantage is not only in license pricing. Logs, metrics, traces, RUM, cloud resources, dashboards, alerts, and incident workflows are handled in one platform, which can reduce the hidden cost of integrating and maintaining separate systems.
Choosing Between Log Monitoring Tools: ELK Stack or TrueWatch
Choose the ELK stack when:
- Your team already has strong Elasticsearch operational experience
- Log search and analytics are the primary requirement
- You want direct control over Elasticsearch internals
- Your retention, index, and pipeline patterns are mature
- Your organization is comfortable managing Elastic architecture and cost
Choose TrueWatch when:
- You need logs, metrics, traces, RUM, infrastructure, cloud resources, and events in one investigation path
- Your team wants to reduce the maintenance burden of a self-built observability stack
- Incidents often require correlation across frontend, backend, middleware, Kubernetes, cloud, and business context
- Query-language consistency matters across signal types
- You want SaaS or managed deployment options, with private deployment available where needed
- You want AI-assisted investigation to work from governed production context, not isolated logs
For more background on building a logging practice, see our guides to log management and log analysis.
Final Takeaway
The ELK stack remains a serious option for log analytics. It is flexible, widely understood, and effective for teams that know how to operate Elasticsearch well.
TrueWatch is built for teams that want logging to be part of a larger observability system. Instead of stopping at centralized log search, it connects logs with metrics, traces, RUM, cloud resources, events, dashboards, alerts, incidents, and AI-assisted workflows.
If your team is evaluating an ELK stack alternative, start with the operating question: do you want to run and tune a search stack, or do you want an observability platform that turns production signals into shared context?
FAQ
What is the ELK stack?
The ELK stack is a set of tools for collecting, storing, searching, and visualizing data, most often log data. ELK stands for Elasticsearch (search and analytics engine), Logstash (data processing and routing), and Kibana (visualization and exploration). Elastic now calls the broader set of components, including Beats and Elastic Agent, the Elastic Stack.
What is the ELK stack used for?
Teams mainly use the ELK stack for centralized logging, log search, and log analytics. It indexes large volumes of data in Elasticsearch and lets engineers explore and chart that data in Kibana.
Is the ELK stack free?
Elastic offers self-managed, hosted, and serverless options, each with different pricing. Software pricing is only one part of the cost. For self-managed deployments, infrastructure, storage, retention, and the engineering time spent on upgrades, scaling, and cluster operations often make up a large share of total cost.
What alternatives are there to the ELK stack?
Alternatives range from dedicated log management tools to full observability platforms. TrueWatch is an ELK stack alternative for teams that want logs connected with metrics, traces, RUM, infrastructure, and incident workflows in one platform, with one query language (DQL) across signal types and SaaS or private deployment options.
What is log monitoring?
Log monitoring is the practice of collecting log data from applications, hosts, and services, then searching, analyzing, and alerting on it to detect and troubleshoot issues. In an observability platform, log monitoring is most useful when logs link directly to the related traces, metrics, and infrastructure context.
