
Unified observability means collecting infrastructure metrics, cloud service data, logs, traces, and user experience data in one platform, so every team investigates the same incident from the same evidence. This customer story shows how a small-to-medium financial solutions provider used TrueWatch to consolidate more than five monitoring tools into one unified observability workflow.
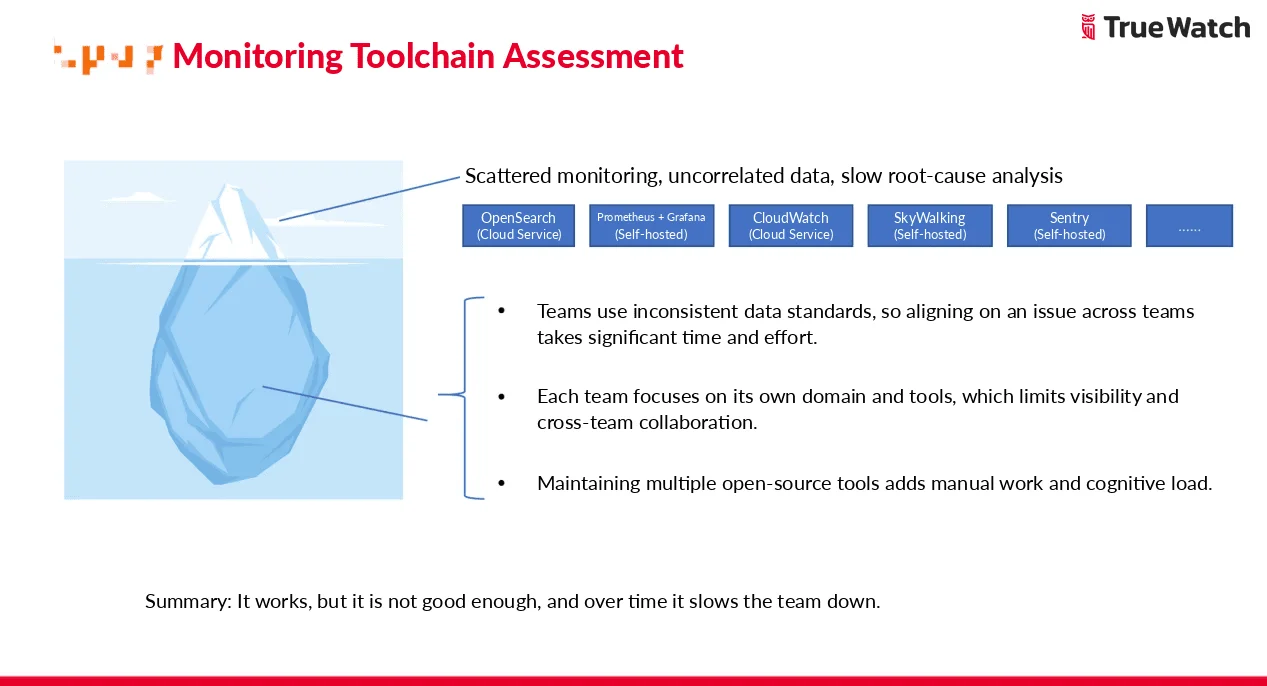
Many engineering teams start with practical tool choices: Sentry for frontend errors, SkyWalking for tracing, Prometheus and Grafana for metrics, OpenSearch for logs, and CloudWatch for AWS services. Each tool does its job. The friction starts later, when one production issue has to be traced across all of them.
The Challenge: Monitoring Tool Sprawl Across Three Teams
The customer's DevOps organization included frontend, backend, and operations teams. Each team owned part of the stack and worked in its own tool:
- Sentry
- SkyWalking
- Prometheus and Grafana
- AWS OpenSearch subscription service
- AWS CloudWatch
This tool sprawl fragmented the data and produced different readings of the same incident. Each team evaluated system behavior from its own view, which slowed agreement on root cause. The self-managed platforms also added maintenance work for the operations team.
After two technical discussions, the teams moved into a proof of concept. Over two weeks, eight people from frontend, backend, and operations validated the main scenarios below.
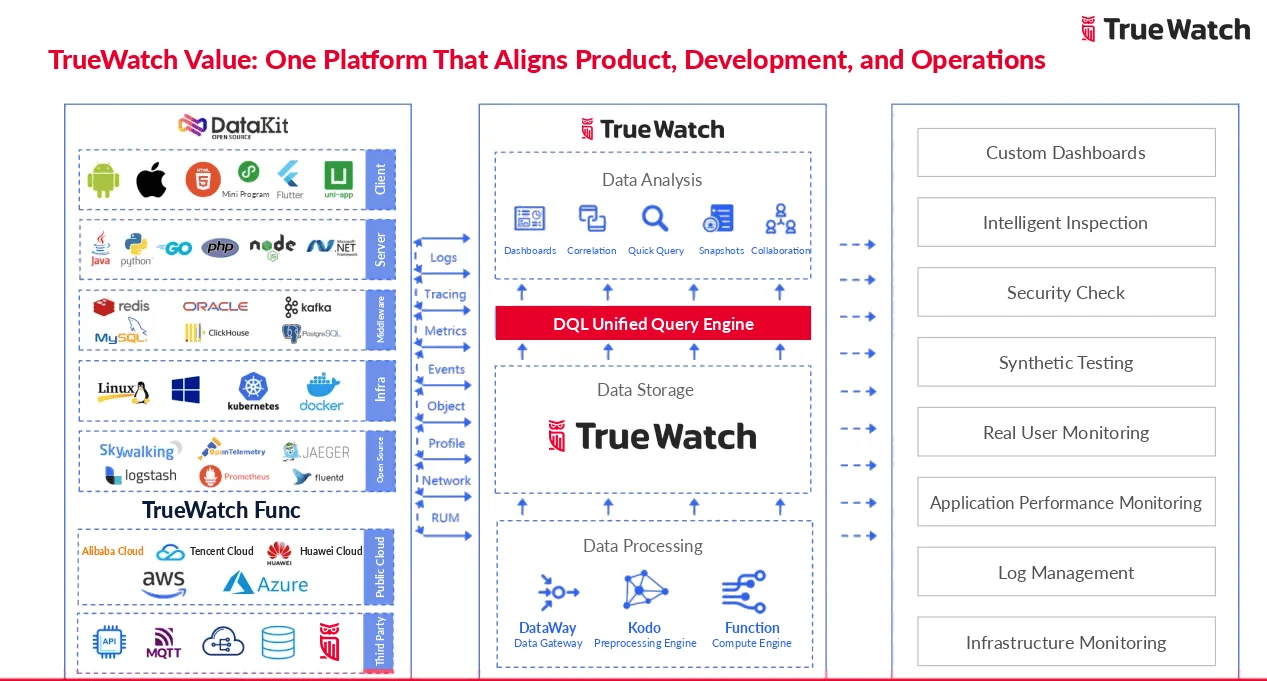
Host and Container Monitoring With DataKit
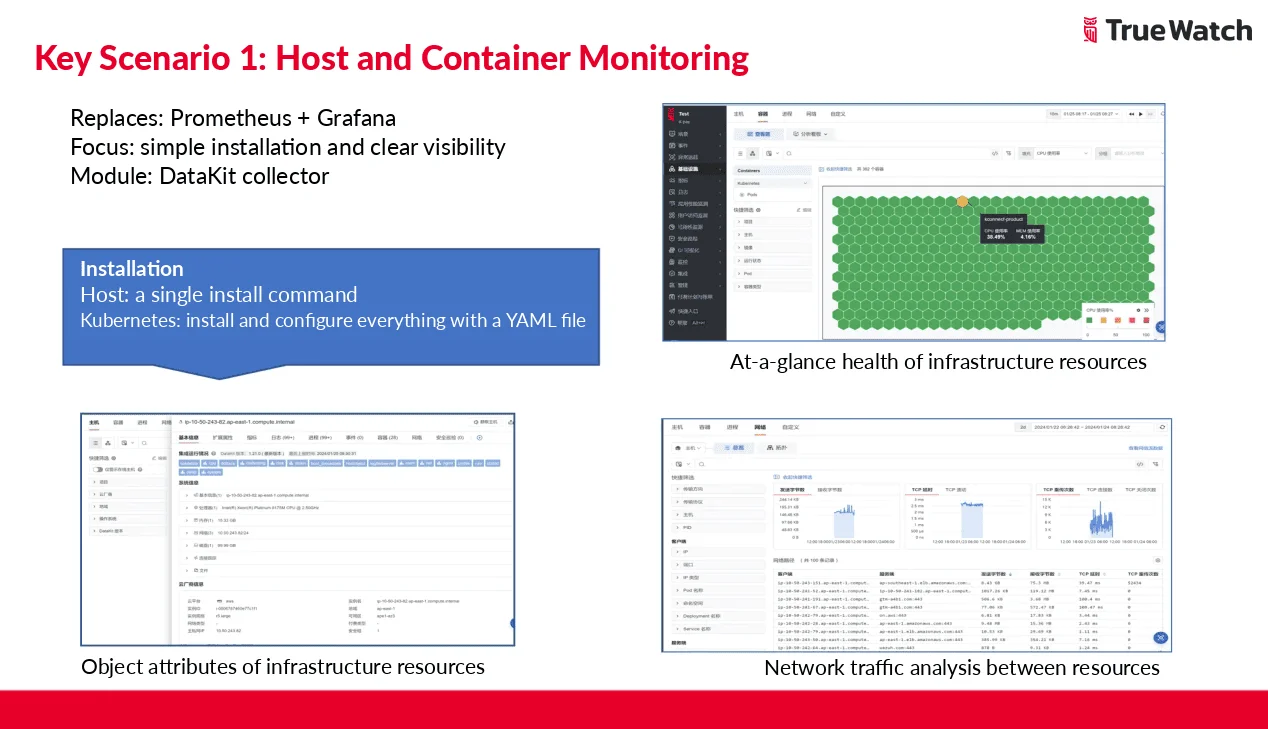
The customer previously used Prometheus and Grafana for host and container monitoring. With TrueWatch, DataKit collected host and container objects and metrics.
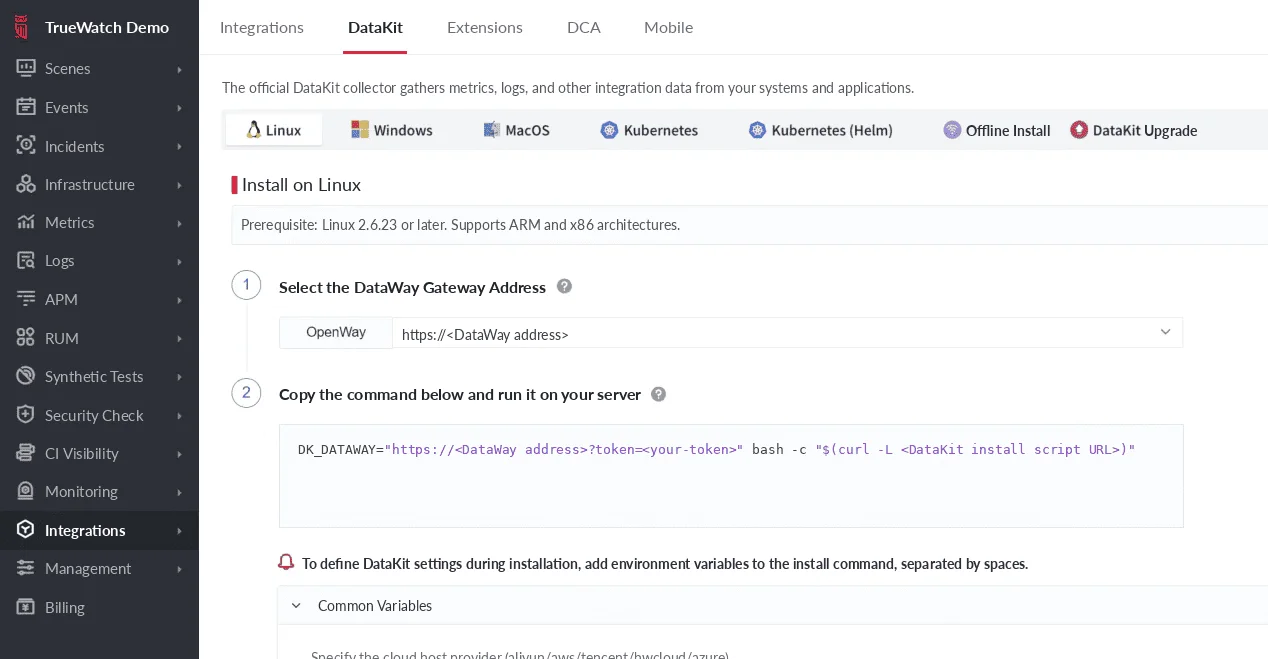
On hosts, DataKit installs with a single shell command.
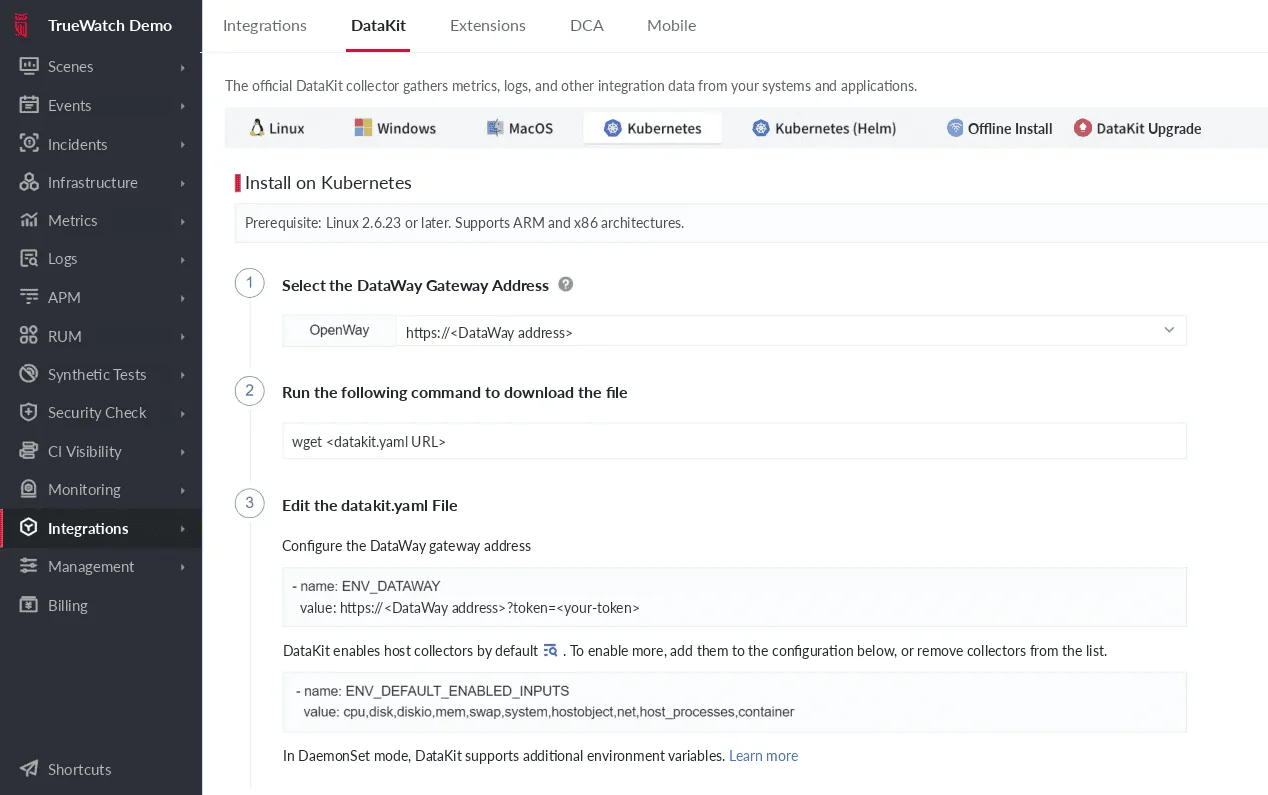
On Kubernetes, DataKit deploys through YAML.
Once DataKit is running, host and container attributes and metrics appear in TrueWatch. Hexagonal honeycomb views help teams spot unhealthy hosts or containers across large fleets.
DataKit can also enable eBPF collection for infrastructure-level network analysis, such as TCP retransmission and latency.
AWS Service Monitoring Beyond CloudWatch
The customer's infrastructure ran on AWS and relied on many PaaS services. CloudWatch coverage did not fully match what the team needed to monitor.
TrueWatch Func is a Python-based platform for developing, managing, and running scripts. Its script library includes monitoring scripts for many AWS services.
Users select a script, configure access keys, region, and the metrics they need, then run it on a schedule. AWS service objects and metrics then appear in TrueWatch alongside the rest of the stack.
Log Collection, Storage, and Correlation
The customer previously used the AWS OpenSearch subscription service for important business logs.
During validation, the team used hot and cold log storage. Recent logs were stored in TrueWatch's own database engine built for observability workloads, while cold logs moved to AWS S3 for backup. When configured, historical audit logs could be queried from the TrueWatch interface, so engineers did not need to switch systems.
The team also needed log blacklist management and alerting on business keywords. TrueWatch supported both workflows.
Correlation stood out during validation. Logs were linked to tracing data and to host and container data, so engineers could click a tag during log analysis and inspect the related infrastructure metrics.
Real User Monitoring and Session Replay
The frontend team previously used Sentry for user experience analysis, focusing on API performance and Session Replay. They had no correlation between frontend activity and backend traces.
TrueWatch Real User Monitoring (RUM) collects and analyzes sessions, views, actions, errors, Long Tasks, and other frontend signals.
Session Replay supports multiple masking modes for sensitive data, so teams can review user experience issues without exposing private information.
Frontend RUM connects to backend APM through trace parameters that the SDK adds to HTTP request headers, which reduces manual instrumentation work.
Distributed Tracing Linked to Logs
The backend team previously used SkyWalking for tracing, but traces and logs were not fully correlated.
TrueWatch supports mainstream APM approaches, including DDTrace, OpenTelemetry, and SkyWalking. During validation, the team collected trace data and adjusted its log output format to enable trace-log correlation.
Because collected data includes extensible fields, engineers could search with key:value queries and explore suspicious behavior across custom dimensions.
Unified Alerting With Existing Incident Response Tools
The customer needed alerts on host metrics and log keywords, with notifications sent to DingTalk groups and PagerDuty phone calls.
TrueWatch provides monitor types including threshold detection, log detection, process detection, and APM detection. Event templates are customizable, and the PagerDuty integration let the team keep its existing incident response habits.
Dashboards for Operations, Frontend, and Product Teams
The customer previously built dashboards in Grafana. Operations focused on containers and AWS services, while the frontend team often helped product teams build business dashboards.
TrueWatch offers multiple chart types and dashboard workflows. Product and operations users can build charts through visual configuration, and engineers can query observability data with DQL.
Metrics, traces, and logs share a consistent query model, and PromQL-style usage is supported to ease migration from the previous stack.
During the two-week validation, the customer configured more than 30 dashboards.
Secure Data Sharing for Financial Services
As a financial services company, the customer needed to keep data secure during collaboration. Teams had been sharing screenshots, remote sessions, or raw logs, which was slow and carried leakage risk.
TrueWatch snapshot sharing lets users save filtered data as a snapshot and share it with colleagues, who can interact with it to a limited degree.
Snapshots support field masking, expiration times, IP allowlists, and encrypted access.
User-Level Investigation From One Starting Point
With TrueWatch, the customer could start an investigation from a user ID and a time range, then follow the path to that user's session, frontend events, backend traces, logs, host, Pod, container, database, and middleware context.
Product, development, and operations teams now share one workflow for analyzing reported issues and can reach the same conclusion sooner.
What Tool Consolidation Changed for the Team
The main change was not swapping one dashboard for another. It was moving from fragmented tools to a shared, unified observability workflow.
For this customer, TrueWatch brought infrastructure monitoring, AWS service monitoring, logs, RUM, tracing, alerting, dashboards, data sharing, and user-level investigation into one platform.
FAQ
What is unified observability?
Unified observability brings infrastructure metrics, cloud service data, logs, traces, and real user monitoring into one platform with a consistent query model. Teams can then investigate an incident from shared data instead of separate tool views.
What is monitoring tool consolidation?
Monitoring tool consolidation means replacing several separate monitoring tools with one platform. In this story, the customer moved host and container monitoring, AWS service monitoring, logs, RUM, tracing, alerting, and dashboards into TrueWatch.
How can DevOps teams reduce tool sprawl?
Start by listing which team owns which tool and where data fails to connect. This customer ran a two-week proof of concept with frontend, backend, and operations engineers to validate each scenario on one platform before consolidating.
Can TrueWatch work with existing incident response tools?
Yes. In this deployment, the PagerDuty integration handled phone notifications, and alerts were also sent to DingTalk groups, so the team kept its existing incident response habits.
