What is TrueWatch application performance monitoring (APM)?
TrueWatch Application Performance Monitoring (APM) provides provides full-stack visibility across applications and services to detect bottlenecks and resolve performance issues in real time. By unifying distributed tracing, code-level diagnostics, and AI-powered insights, TrueWatch ensures seamless user experiences and optimizes system reliability across complex microservices and cloud-native architectures.
What is APM?
APM definition
Application performance monitoring (APM) is a critical capability in modern observability platforms and APM tools. It enables teams to monitor application performance, analyze system behavior, and resolve issues in real time.
As applications become more distributed, organizations rely on APM software to gain visibility into performance, detect bottlenecks, and ensure a seamless user experience.
APM functions
With the right application performance monitoring tool, teams can:
- Identify why applications are slow
- Detect where failures occur
- Understand how performance impacts users
What TrueWatch APM can do
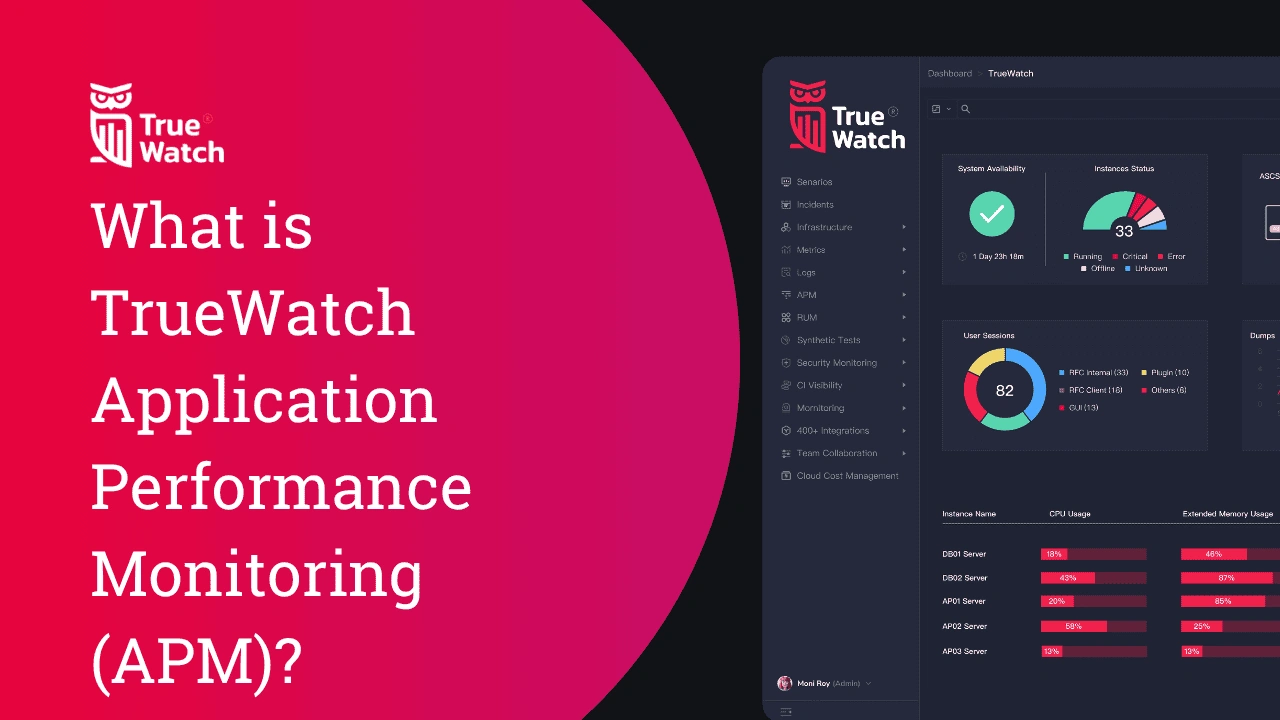
TrueWatch APM provides end-to-end visibility across applications, services, and infrastructure.
- End-to-End Distributed Tracing: Track every request from frontend to backend, visualize service dependencies and request flows, and quickly identify latency issues and bottlenecks across microservices.
- Real-Time Application Monitoring: Monitor key performance metrics - including response time, throughput, and error rates - while detecting anomalies in real time to prevent user impact.
- Full-Stack Observability: Gain unified visibility across applications, infrastructure, and services in a single platform, eliminating data silos and fragmented monitoring tools.
- Root Cause Analysis: Correlate logs, metrics, traces, and infrastructure data to quickly pinpoint the source of issues and accelerate troubleshooting.
- Code-Level Diagnostics: Analyze methods, threads, and execution paths to uncover performance bottlenecks and optimize application behavior at the code level.
How TrueWatch APM works
TrueWatch APM works by ingesting telemetry from instrumented applications and infrastructure, reconstructing request paths across services, linking that trace data with related operational context, and surfacing the result through investigation and detection workflows. Rather than treating logs, metrics, and traces as separate signals, it helps teams analyze application behavior as a connected system.
- Telemetry Ingestion: TrueWatch ingests telemetry from instrumented services and runtime environments through DataKit and supports tracing integrations, collecting distributed traces, metrics, and logs as the foundation for application performance analysis.
- Request Path Reconstruction: The platform rebuilds end-to-end request paths across distributed services and dependencies, allowing teams to see how transactions move through the system and where latency, retries, or failures are introduced.
- Contextual Correlation: TrueWatch connects trace data with related logs, infrastructure signals, and service context, so teams can investigate issues with the surrounding operational evidence instead of analyzing each signal in isolation.
- Investigation Views: Trace and service behavior is surfaced through analysis views such as service relationships, request-level trace details, and performance investigation workflows, helping teams isolate bottlenecks and abnormal behavior more efficiently.
- Detection and Troubleshooting: On top of trace and application data, TrueWatch helps teams detect abnormal performance patterns, surface likely issues earlier, and shorten troubleshooting time through integrated monitoring and analysis workflows.
Read—What is (APM) application performance monitoring?
Why TrueWatch APM?
TrueWatch APM stands out by combining deep application tracing with broader observability context in one platform. Instead of treating APM as a separate tool, it brings together request-level analysis, service relationships, infrastructure signals, logs, and user experience data so teams can move from detection to investigation with much less guesswork.
- More Than Standalone Tracing: TrueWatch does more than capture traces. It supports end-to-end trace analysis while correlating application activity with infrastructure, logs, and user access data, giving teams a wider operational picture during incidents.
- Deeper Investigation Workflows: Beyond dashboards, TrueWatch supports analysis through flame graphs, span lists, waterfall charts, service views, and resource-level trace exploration, helping teams isolate where performance time is spent and where issues propagate.
- Built for Distributed and Cloud-Native Systems: TrueWatch is designed for distributed architecture applications and supports deployment patterns for hosts and Kubernetes environments, making it a stronger fit for modern service-based systems than basic monolithic-era monitoring approaches.
- Faster Root Cause Analysis: By connecting request paths with surrounding operational context, TrueWatch helps teams narrow issues to the affected service, dependency path, or resource instead of troubleshooting each signal separately.
- Observability with Cost Control: TrueWatch supports APM sampling controls for managing trace volume and storage overhead, which makes it easier to scale observability without treating visibility and cost as a zero-sum tradeoff.
- AI-Powered Observability: With AI-assisted analysis, automated anomaly detection, and intelligent troubleshooting, TrueWatch enables teams to resolve issues faster and move toward AIOps-driven operations.
Frequently asked questions (FAQs)
Q: How does TrueWatch APM help identify slow database queries?
A: TrueWatch uses distributed tracing to track requests as they move from the application to the database. By analyzing the "span" of the query in a waterfall chart, developers can see exactly which SQL statement is causing latency and optimize it immediately.
Q: Can I use TrueWatch APM for applications running in Kubernetes?
A: Yes, TrueWatch is built for cloud-native systems and provides native support for Kubernetes environments. It automatically maps dependencies between pods and services, ensuring you have clear visibility into containerized microservices.
Q: Does TrueWatch APM impact application performance during data collection?
A: TrueWatch is designed with a lightweight collection approach to ensure minimal overhead on your production systems. By using smart sampling controls, you can capture high-fidelity trace data without compromising the speed of your application.
Q: What is a "flame graph" in the context of TrueWatch APM?
A: A flame graph is a visualization tool in TrueWatch that shows the call stack of an application during a request. It allows engineers to visually identify which specific function or method is consuming the most CPU or time, making code-level optimization much faster.
Q: How does TrueWatch link logs to specific application traces?
A: TrueWatch automatically correlates logs and traces by injecting unique Trace IDs into your application data. This means when you find a slow request in the APM view, you can click directly into the specific logs generated by that exact request to see the error details.
Next steps
Ready to see where your applications are really performing - and where they’re not? Book a demo today to see how TrueWatch APM provides full visibility and optimizes your performance across every service.
If you want to learn more, check out our guides on distributed tracing, root cause analysis, and AI-powered observability to take your application monitoring to the next level.
