
Every engineering team that has switched observability vendors knows the real cost isn't the contract — it's re-instrumenting every service, rewriting every exporter, and retraining the on-call rotation on a new agent. That's the exact problem OpenTelemetry was built to solve, which is why its official Vendors list has quietly become one of the most-watched pages in the observability industry: it's the closest thing the market has to a neutral answer to "which platforms can I actually trust with OTel data?"
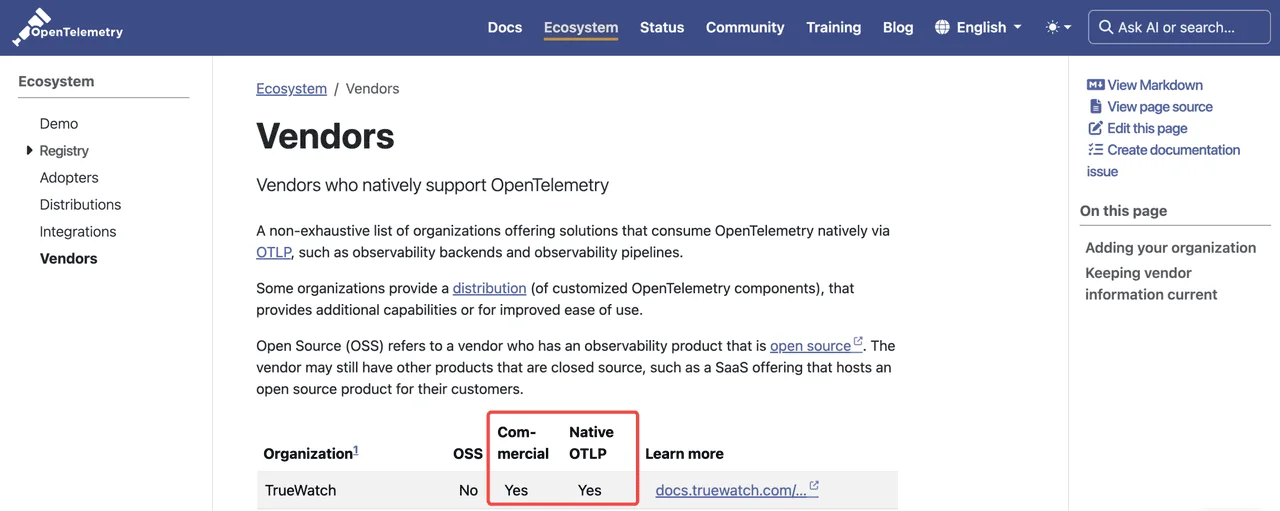
TrueWatch is now on that list — named alongside AWS, Microsoft Azure, Google Cloud, Datadog, Dynatrace, Elastic, Grafana Labs, New Relic, and Splunk, with two attributes marked next to our name: Commercial: Yes and Native OTLP: Yes.
Why Vendor-Neutral Telemetry Is Now Table Stakes
OpenTelemetry (OTel) is the CNCF-hosted open source standard for generating, collecting, and transmitting traces, metrics, and logs in a vendor-neutral format. It exists because the old model — instrument once, lock in forever — stopped making sense the moment observability became a multi-year, multi-vendor decision for most engineering orgs.
"Enterprises are done picking a vendor first and hoping the tooling catches up later. With OpenTelemetry, the standard comes first — vendors either meet it or get left out of the conversation. Being listed means TrueWatch is now part of that default conversation for any team standardizing on OTel." — Mike Loong, CEO, TrueWatch
That shift matters most for teams in fast-growing markets — the U.S., Singapore, Indonesia — where infrastructure is often built cloud-first and multi-region from day one. Standardizing on OpenTelemetry means the instrumentation layer stays constant even as the backend, the region, or the vendor changes underneath it.
What TrueWatch's Listing Adds to the OpenTelemetry Vendor Map
The OpenTelemetry Vendors page isn't a marketing directory — it's a registry of platforms that can natively consume OTel data over OTLP and turn it into a usable observability solution for end users, not just a pass-through pipe. Getting listed means passing that bar, not just claiming OTel "support" in a datasheet. For teams currently comparing platforms, this changes where TrueWatch sits on the map: not as an alternative that happens to accept OTel data, but as a peer to the vendors already on that list.
"For teams evaluating us alongside Datadog, Grafana, or New Relic, this changes the question from 'which proprietary agent do we lock into' to 'which OTel-native backend fits our stack.' That's a much easier yes — and a much easier decision to walk back if it doesn't work out." — Brandon Foo, Head of Growth & GTM, TrueWatch
Inside TrueWatch's Native OTLP Support
Native OTLP support sounds simple on paper — receive data, store data. In practice, it's the difference between a platform that merely accepts an OTLP payload and one that can make that data useful under real production load.
TrueWatch ingests OpenTelemetry Traces, Metrics, and Logs natively through DataKit's OpenTelemetry input, bringing telemetry from any language or framework into a single observability context. At the protocol level, TrueWatch supports:
- OTLP over gRPC
- OTLP over HTTP/Protobuf
- Independent endpoints for Traces, Metrics, and Logs
- gzip compression for both HTTP and gRPC transport
- OpenTelemetry Java Agent, both V1 and V2
"Supporting OTLP isn't just about opening a gRPC or HTTP endpoint. The real work happens after ingestion — sampling decisions, cardinality control, keeping trace-to-log correlation intact at production scale. That's what actually earned us this listing, not just a config flag." — Jimmy Soh, Head of Product & Solutions Engineers, TrueWatch
Built for Production: Sampling, Governance, and Cost at Scale
Accepting OTLP traffic is one thing. Keeping it useful — and affordable — at production scale is another. TrueWatch's OpenTelemetry integration is built around three production requirements engineering teams consistently ask for:
- Flexible governance — trace sampling, rare-resource retention, error filtering, tag allow/deny lists, and local caching, so teams keep the signal that matters without paying to store everything
- Compatible analysis — request volume, error rate, latency, and Apdex scores extracted directly from trace data, with compatibility for legacy DDTrace instrumentation so teams can migrate without a rip-and-replace
- Unified context — traces, metrics, and logs land in the same observability model instead of three disconnected silos
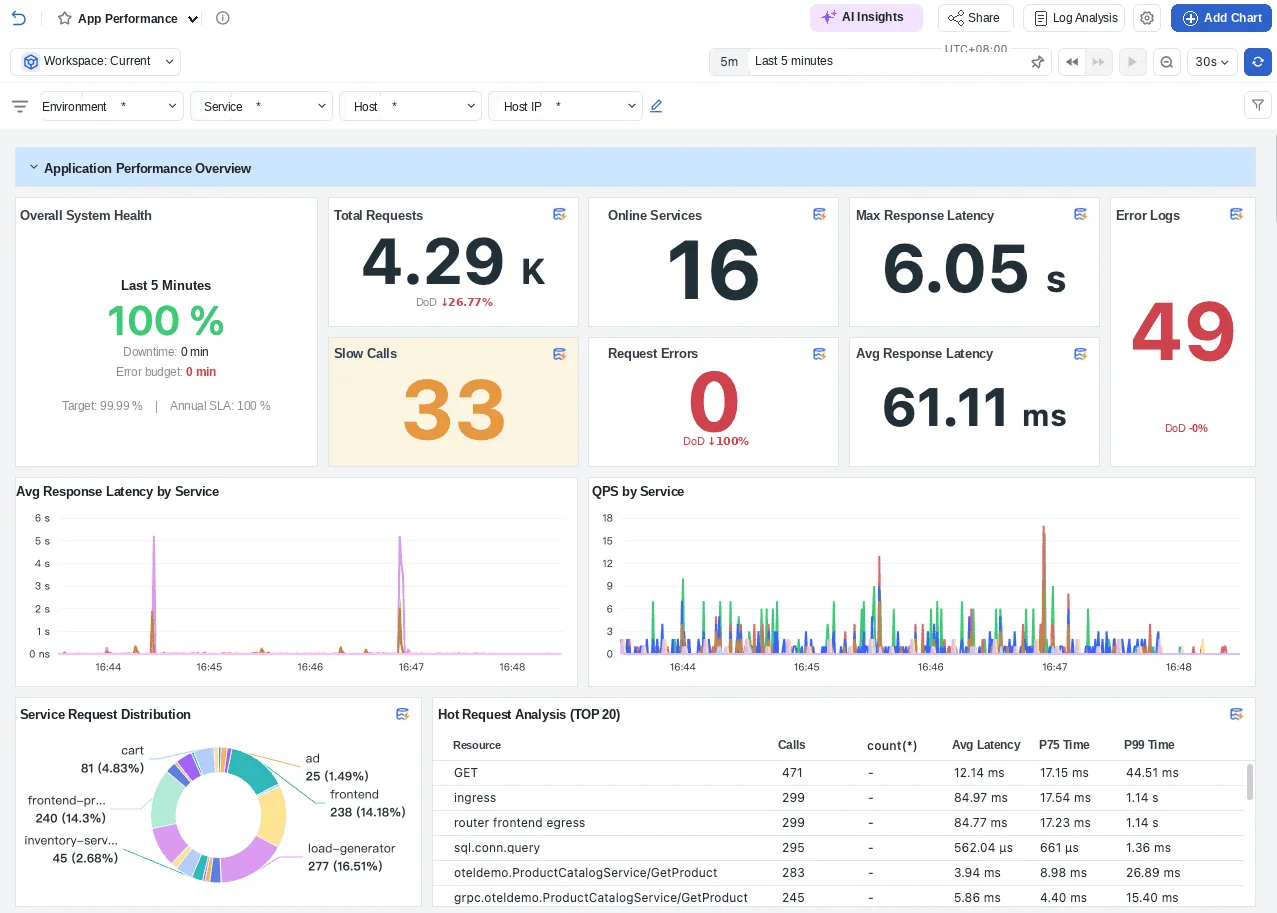
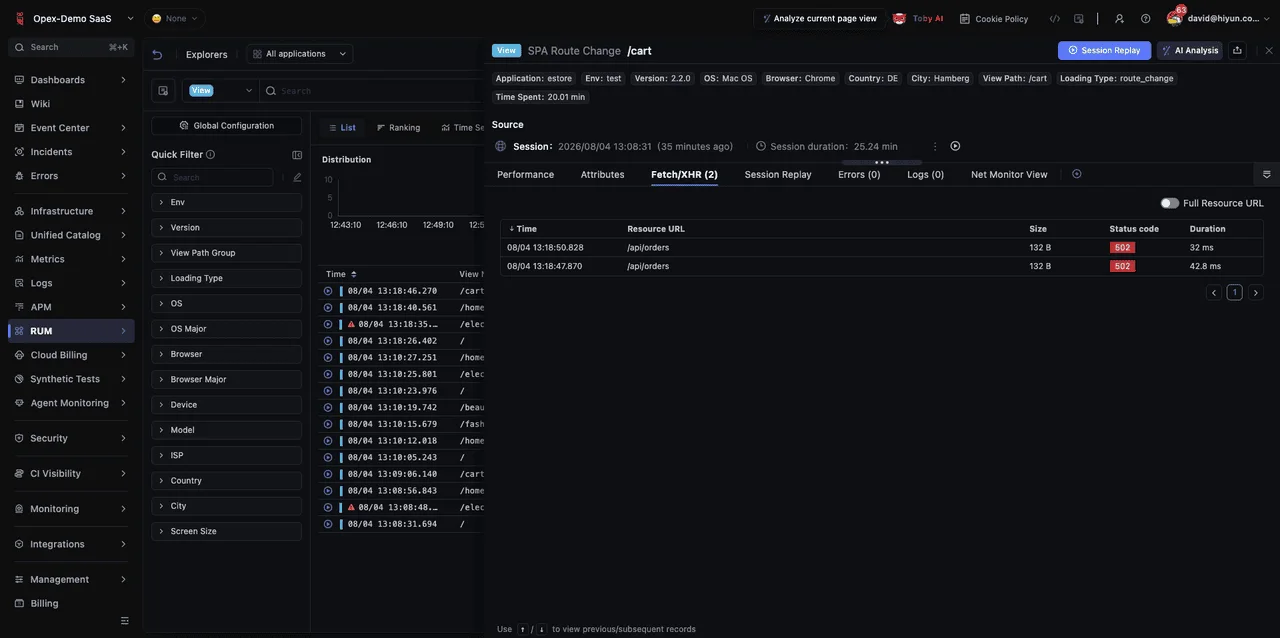
This is also where the limits of OpenTelemetry itself become clear: OTel solves how telemetry is generated, collected, and transported — it doesn't solve how a team finds an anomaly, correlates it across signals, and closes the loop on an incident. That still requires a full observability platform underneath it. TrueWatch combines OTel-sourced data with APM, infrastructure and container monitoring, log management, user experience monitoring (RUM), alerting, and incident management, so a trace doesn't just arrive — it becomes part of a discover-analyze-locate-resolve workflow.
One Platform, 650+ Integrations — OpenTelemetry Is Just the Start
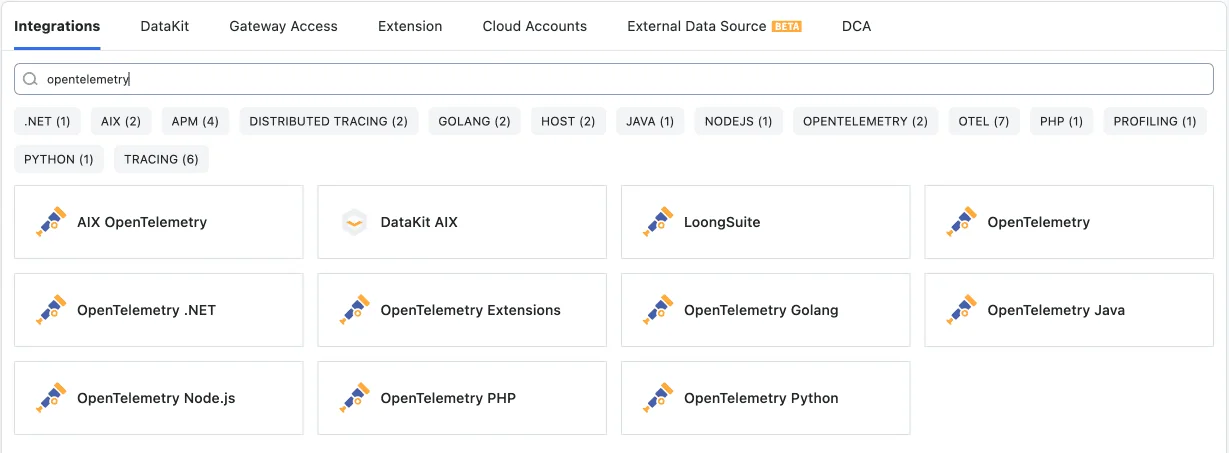
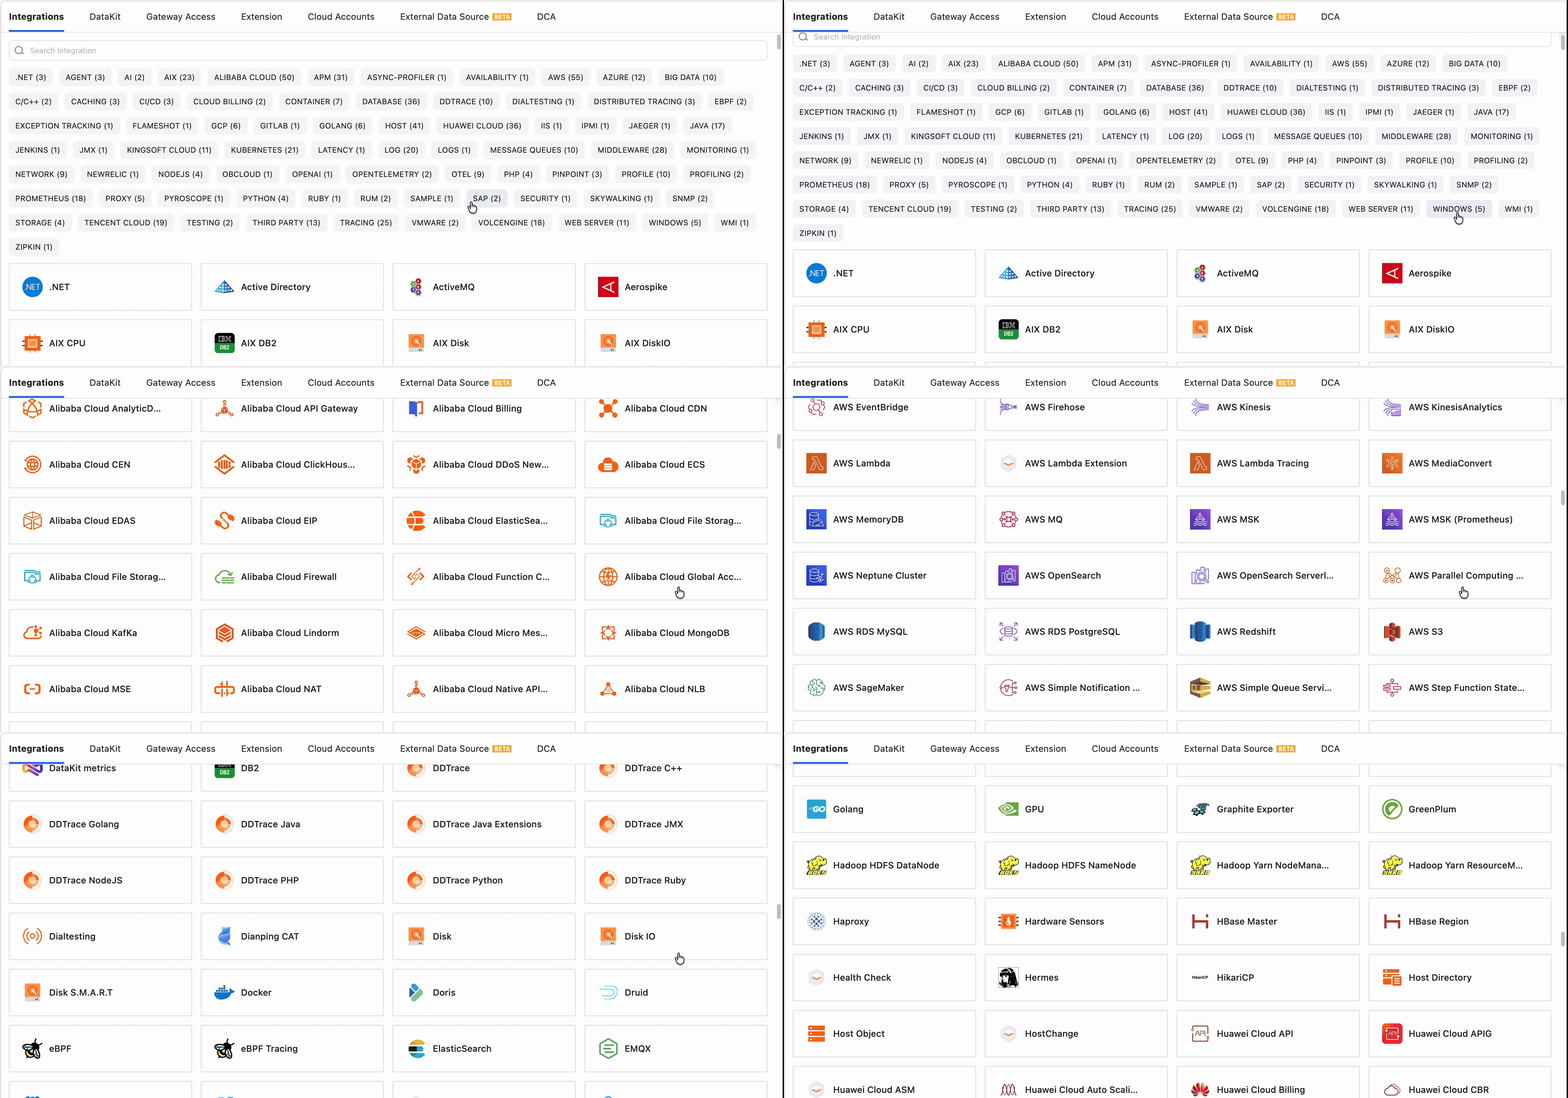
OpenTelemetry is one path into TrueWatch — not the only one. The platform currently supports 650+ integrations across hosts, containers, Kubernetes, cloud platforms, databases, middleware, network devices, logs, applications, and RUM, and is compatible with OpenTelemetry, Prometheus, and Telegraf as collection methods side by side.
That breadth matters in practice: most engineering orgs aren't running a single, pure-OTel stack — they're running OTel next to Prometheus exporters, legacy agents, and cloud-native integrations that predate their OTel migration. DataKit's unified collection layer means teams don't have to choose one collection method and rip out the rest; they can adopt OpenTelemetry at their own pace while everything else keeps reporting into the same observability context.
Learn more:
- OpenTelemetry Official Vendors page: https://opentelemetry.io/ecosystem/vendors/
- TrueWatch OpenTelemetry integration docs: https://docs.truewatch.com/integrations/opentelemetry/