OWL CLI & MCP Server – Let AI Agents Query TrueWatch Observability Data Directly
From the terminal to AI IDEs like Claude Code and Cursor, OWL CLI and OWL MCP Server turn TrueWatch's logs, metrics, traces, events, APM, RUM, and infrastructure data into tools an AI Agent can call directly — within the permissions you set.
product features
Works With Every Major AI IDE and Desktop Client
OWL CLI installs by handing an AI agent a copy-paste install command, or by installing it manually on Linux/macOS. OWL MCP Server just needs an endpoint and an auth token configured — then Claude Code, Cursor, Claude Desktop, Codex, Trae, Windsurf, and VS Code can all call it directly, with no custom integration work required.

One Set of Observability Capabilities, Shared by Engineers and AI Agents
- Whichever entry point you use, the underlying capabilities are the same:
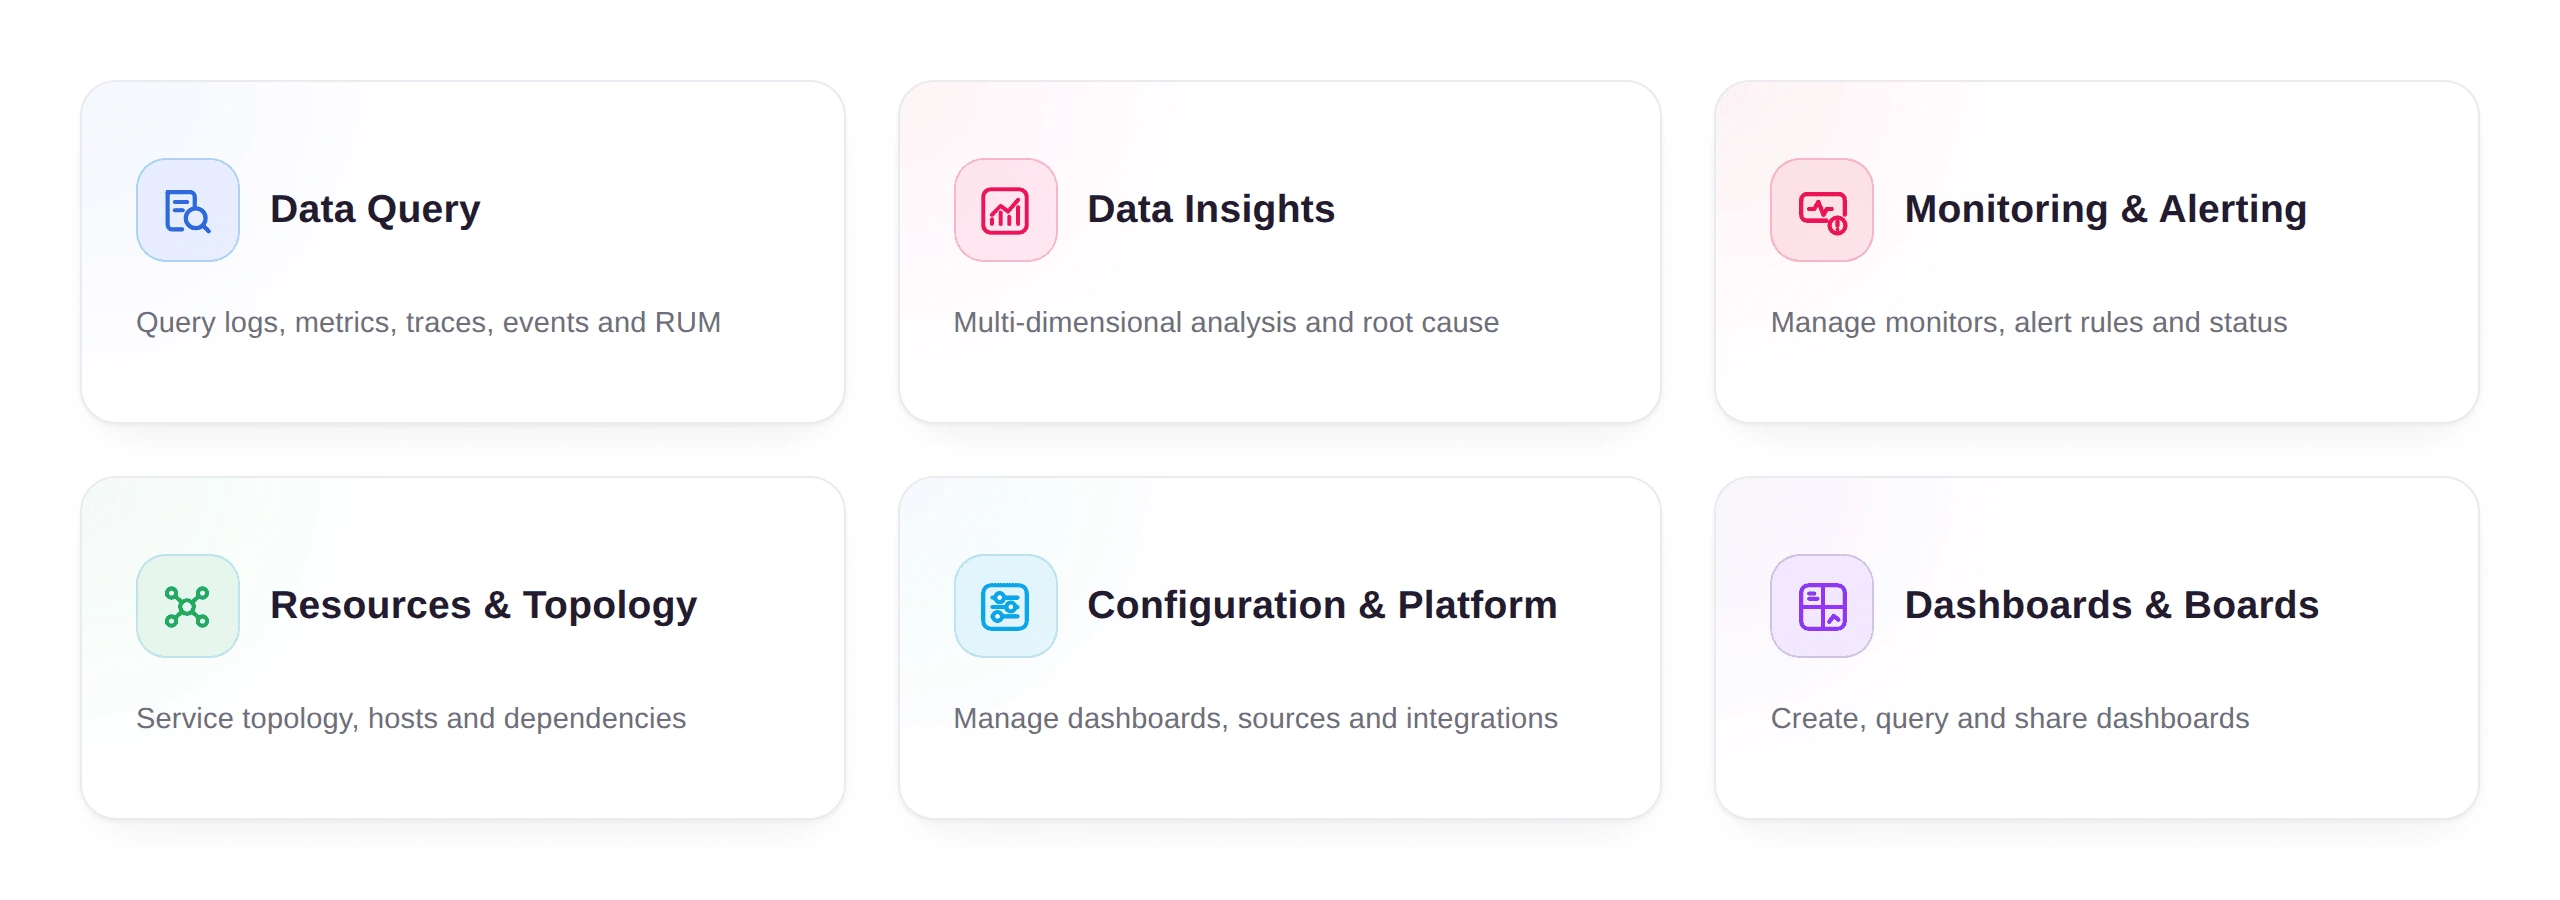
- Data Query — logs, metrics, traces, events, RUM, and more
- Data Insight — multi-dimensional analysis, correlation, root cause
- Monitors & Alerts — rule management and alert status
- Resources & Topology — service topology, host resources, dependencies
- Dashboards & Views — create, query, and share
- Configuration & Platform — data source and platform settings
From Guesswork to Evidence: A Reviewable, Traceable Troubleshooting Process
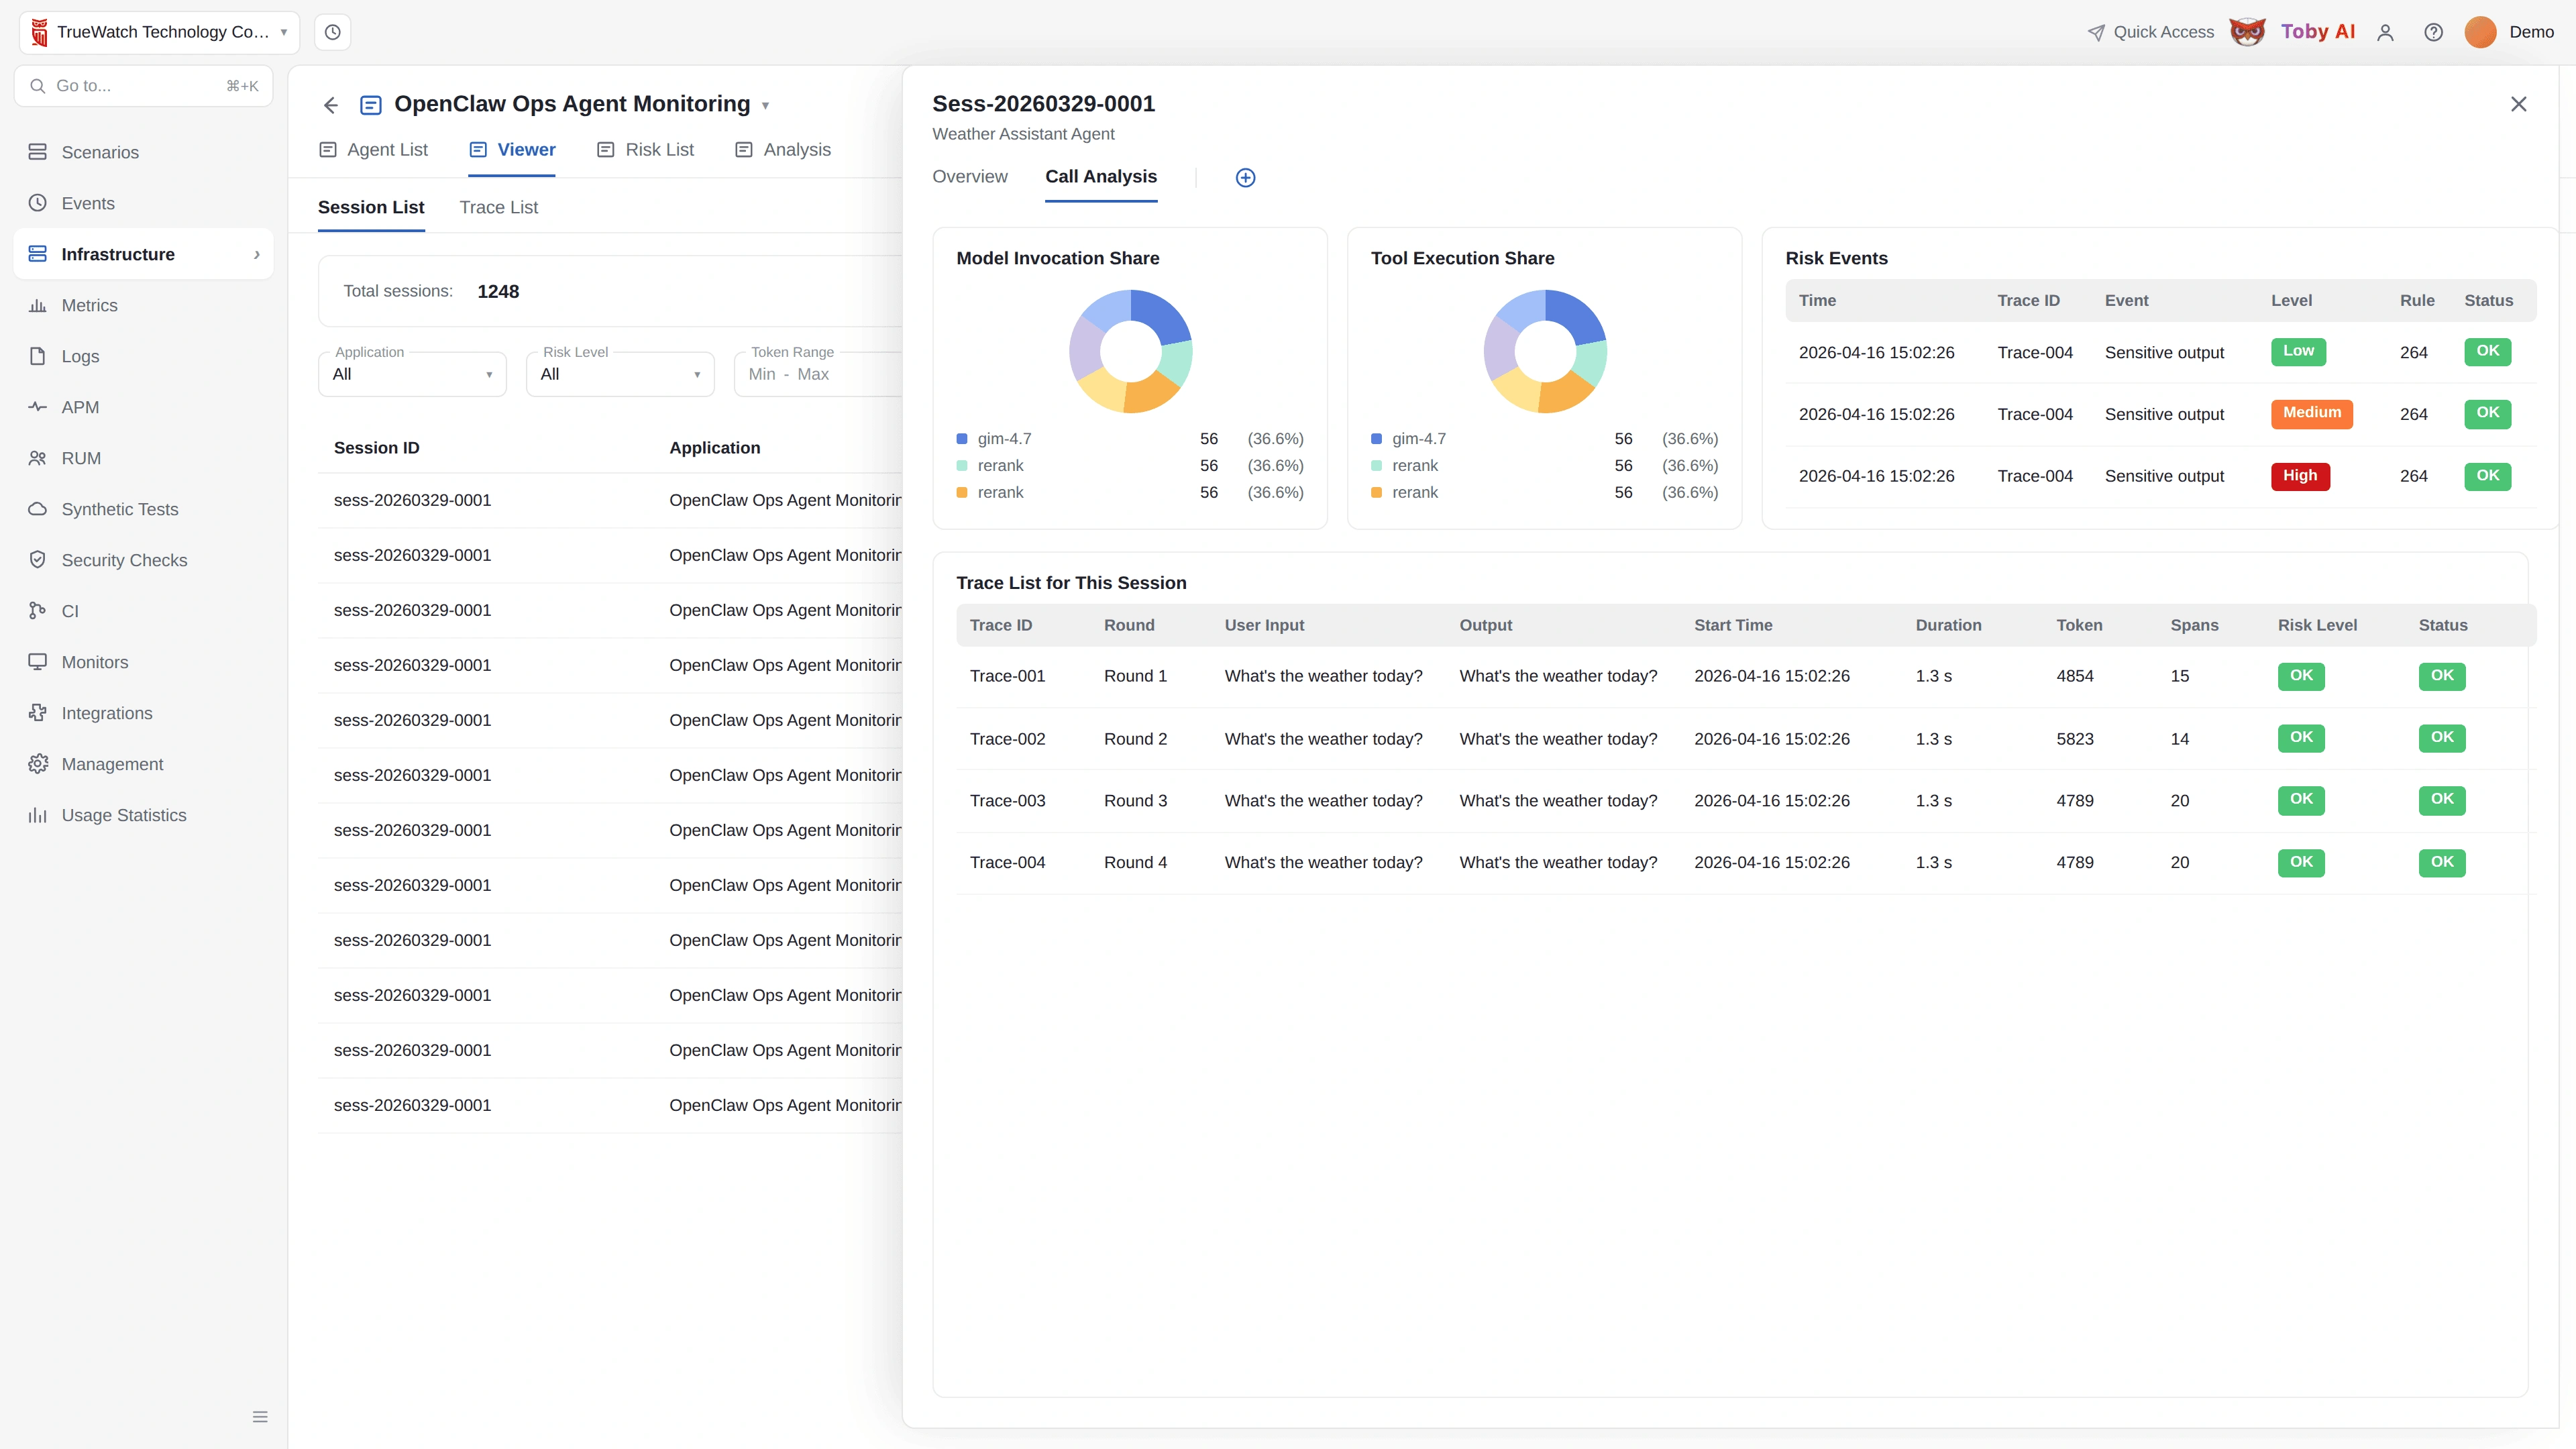
AI assistants typically lack ground truth. They don't know which service is actually failing, copying observability data over by hand is expensive, and their troubleshooting process is hard to review.
OWL CLI and OWL MCP Server open up authorized tools and context directly to an AI Agent, making cross-domain diagnosis (logs, traces, and metrics together) and human-AI collaborative troubleshooting possible — AI moves from guessing to evidence-based analysis, and the whole process becomes traceable and reviewable.
Three Real Scenarios, From Alerts to Daily Reports
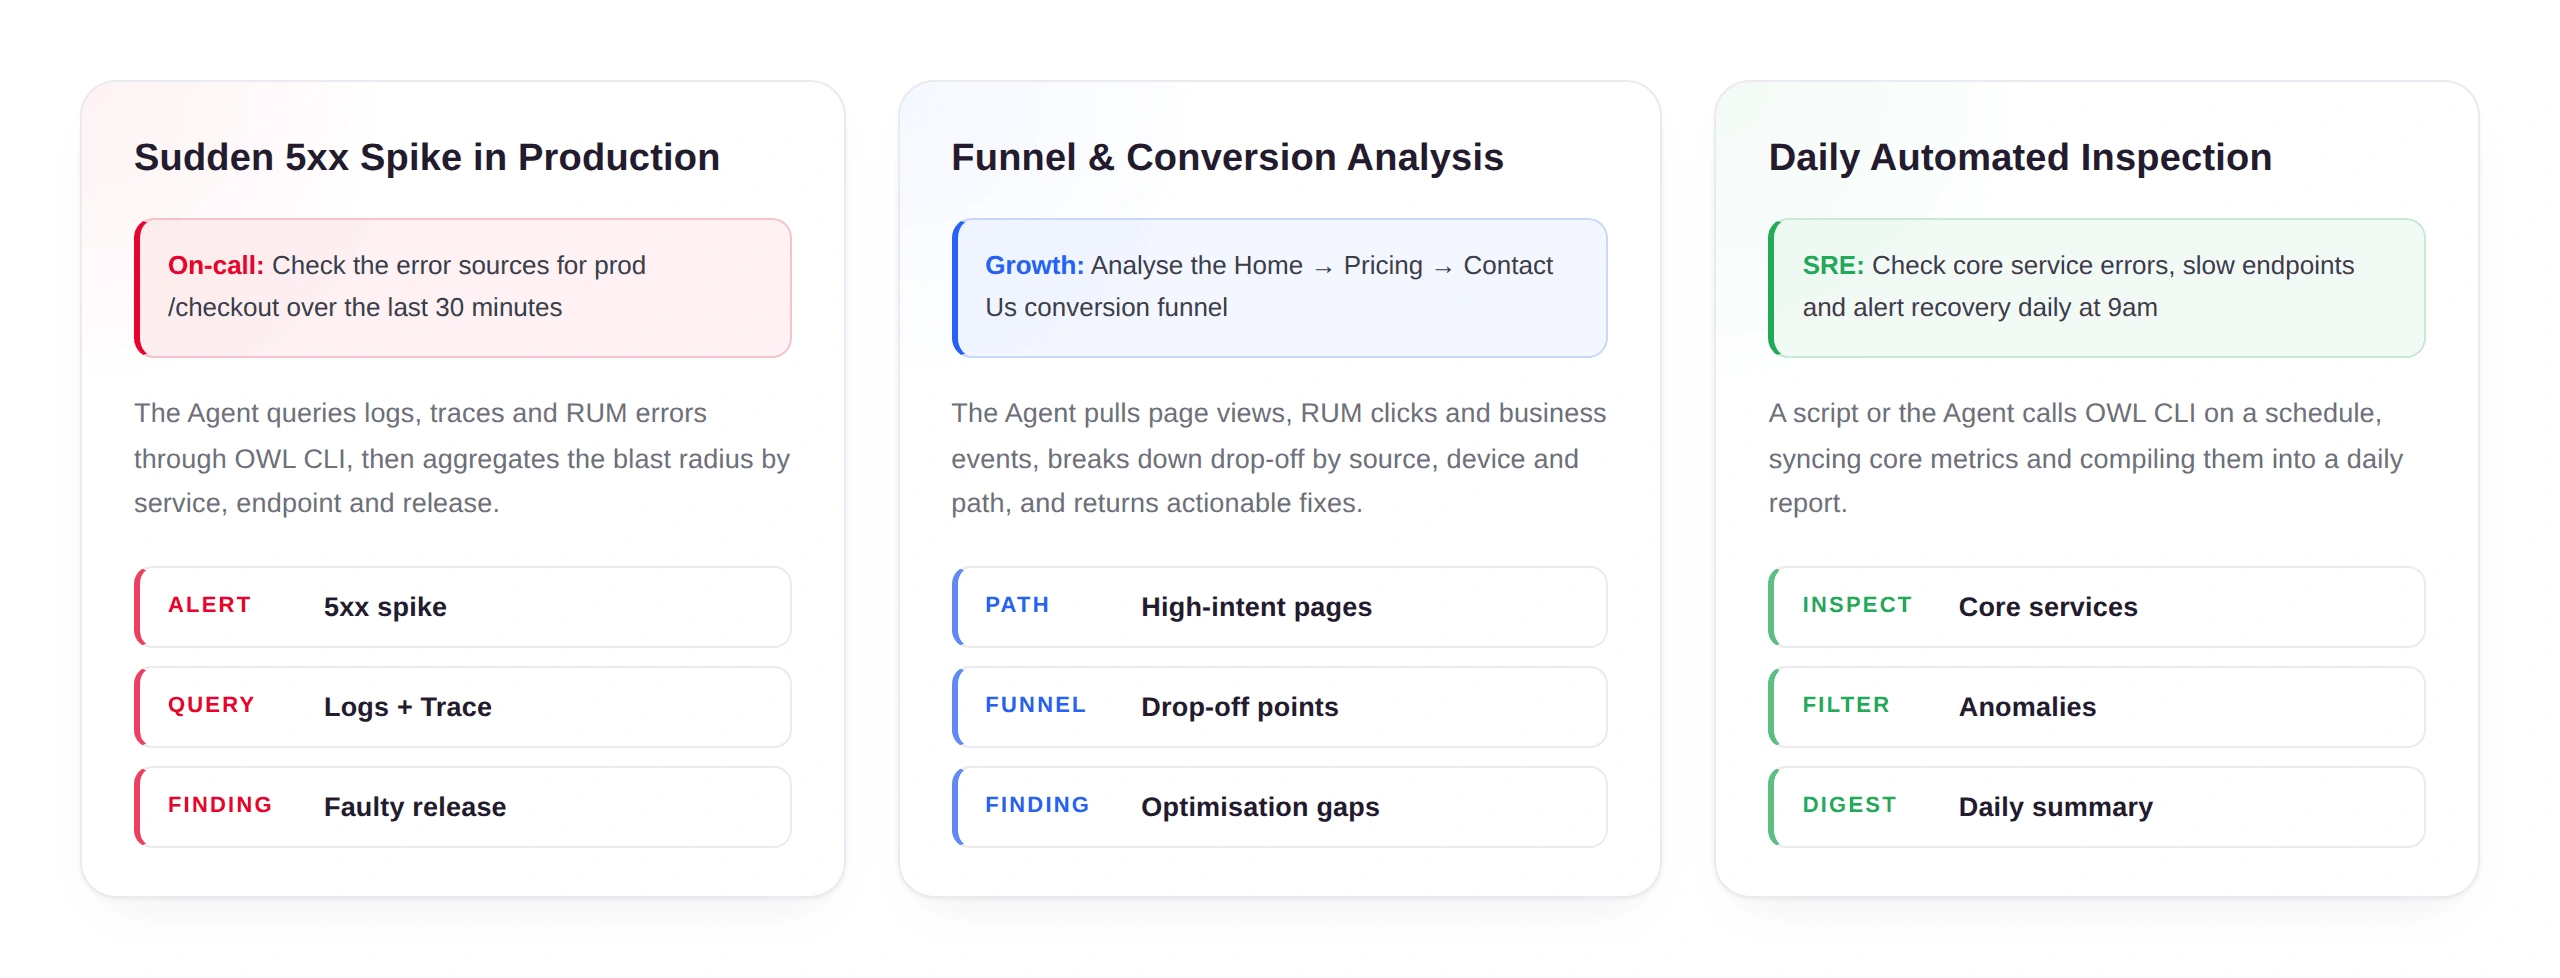
- Spike in 5xx errors: An alert fires, logs and traces get queried, and the offending release gets identified.
- Conversion funnel analysis: High-intent pages get compared against drop-off points to surface optimization opportunities.
- Daily automated health checks: Core services get checked, anomalies get filtered out, and the results roll up into a daily summary.