
AI agent observability exists because an AI agent does not behave like a normal web service. A single user request can trigger a chain of internal decisions — intent classification, permission checks, skill dispatch, model inference, tool execution, sub-agent delegation, and result synthesis all inside one session. Traditional APM shows the outer request. It rarely shows what happened in between.
That gap is what TrueWatch Toby AI Agent Observability is built to close. It gives teams a cross-framework view of agent behavior: sessions, traces, spans, model calls, tool execution, token usage, risk events, and the system context around them.
Why Traditional APM Isn't Built for Agents
An agent's core execution unit isn't an HTTP request — it's a reasoning and action chain. A single task can include intent analysis, permission checks, skill dispatch, model inference, retrieval-augmented context, tool execution, and sub-agent delegation.
Standard APM still captures the surrounding service calls, latency, and errors. But it can't answer the questions agent teams actually need answered:
- What happened at each step of the reasoning chain?
- Which tools were called, and did they succeed?
- Which model ran at which step, and how many tokens did it use?
- Did the workflow trigger a risk policy?
- How did a parent agent delegate work to a sub-agent?
Without that visibility, cost, risk, and reliability all become guesswork.
TrueWatch's AI Agent Observability Platform: Built on OpenTelemetry
TrueWatch's AI agent observability platform runs on an OpenTelemetry-based architecture, so agent behavior is reported without touching core business logic. For an OpenClaw-based agent, the reporting path looks like:
openclaw-otel-plugin → DataKit → TrueWatchAgent frameworks are still evolving fast, which is exactly why a shared telemetry standard matters. OpenTelemetry lets TrueWatch connect agent behavior to the same infrastructure traces, service traces, logs, metrics, and events teams already rely on — instead of building a one-off adapter for every new framework.
AI Agent Observability Dashboard: Session and Trace Views
TrueWatch's AI agent observability dashboard works at two levels.
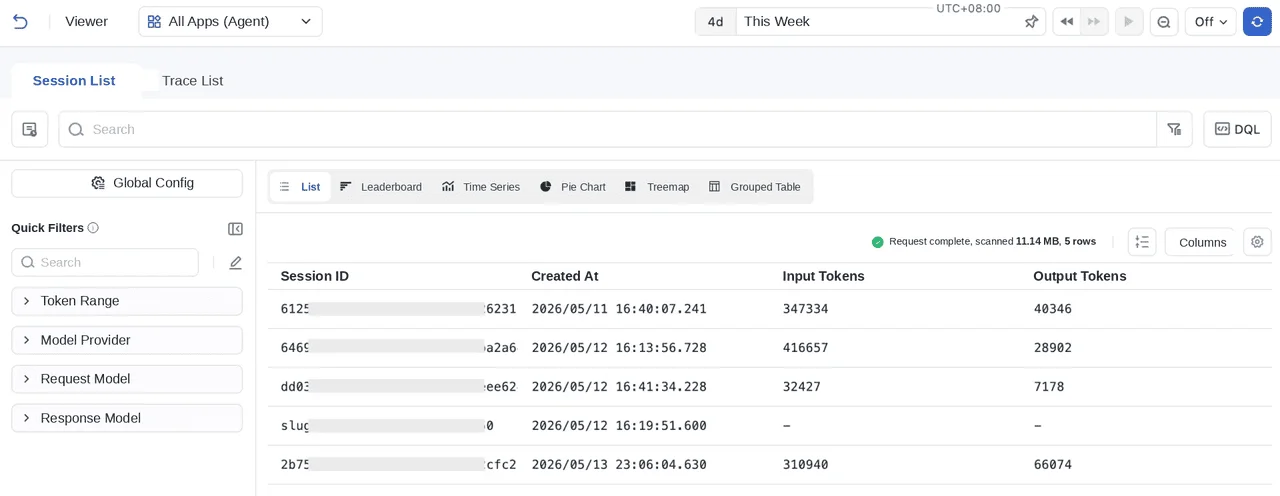
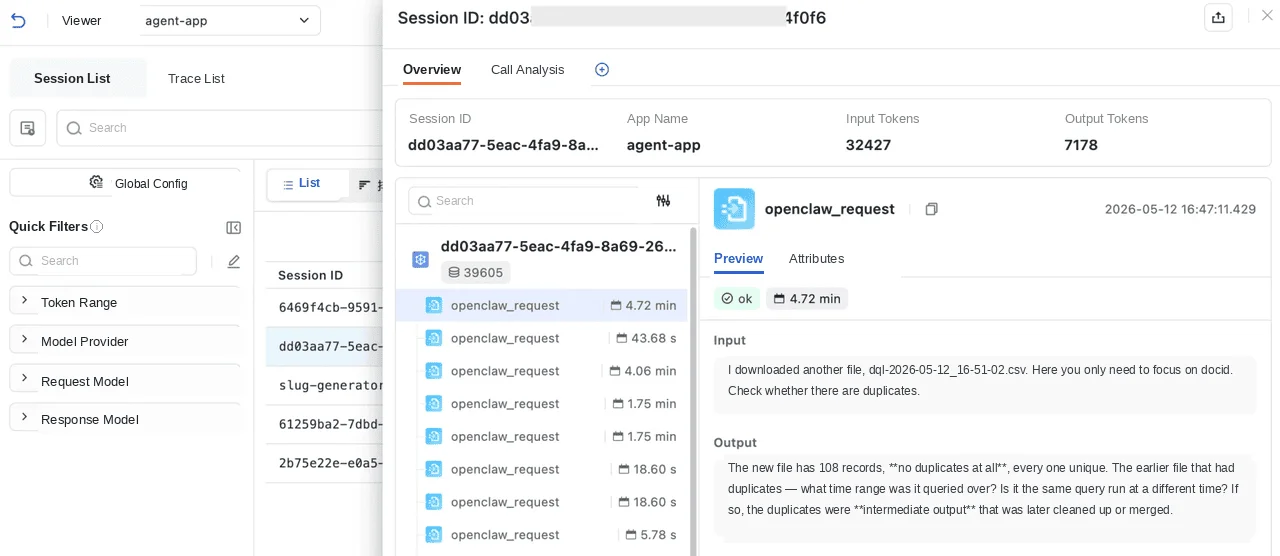
Session view. Each session aggregates a full user interaction — start and end time, latest intent, trace count, total token usage, risk event count, and alert level. A timeline highlights unusually active periods, repeated retries, or sudden shifts in execution pattern.
Trace view. Inside a session, the trace waterfall lays out the execution chain step by step: intent classification, prompt formatting, model request, retrieval, tool call, and output generation. Each span carries duration, token count, status, and input/output detail where policy allows. This is what AI agent tracing looks like in practice — not a single request/response pair, but every decision point in between made visible and searchable.
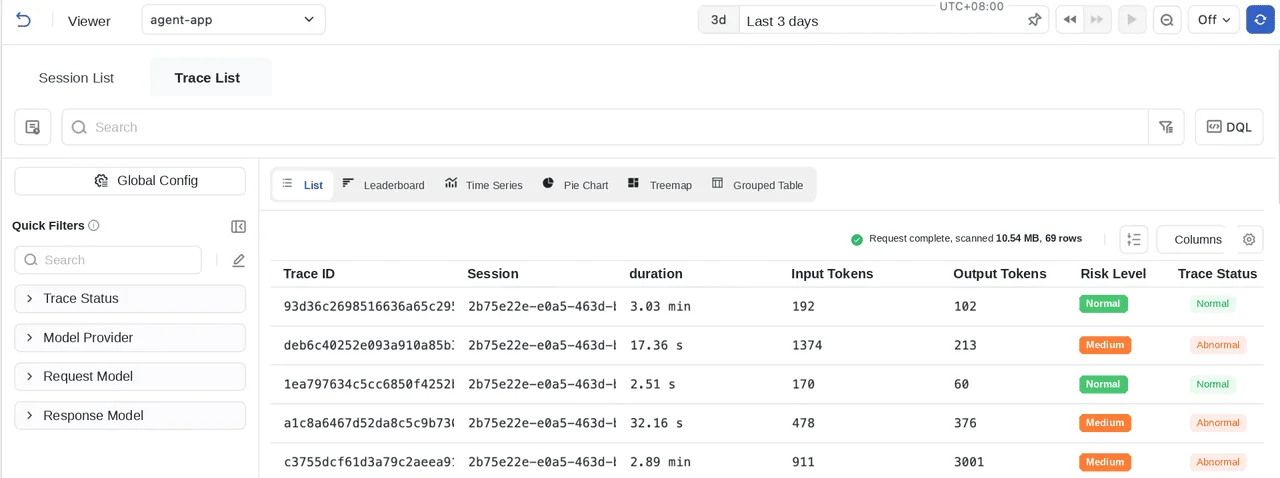
At the trace list level, engineers can filter by trace ID, agent name, risk level, token range, or status to isolate high-risk or abnormal executions fast.
AI Agent Monitoring for Cost: Attribution Across Models and Tools
Agent cost swings far more than typical service resource usage. The same user-facing feature can burn very different token volumes depending on the prompt, the retrieval result, the model selected, retry behavior, or the tool chain involved.
TrueWatch's AI agent monitoring view breaks down the split between model calls and tool executions inside a session, so teams can answer:
- Which model accounts for the most token usage?
- Is reranking firing more often than it should?
- Are file-reading tools adding latency?
- Is an external API the actual bottleneck?
- Which session or trace is driving unusual cost?
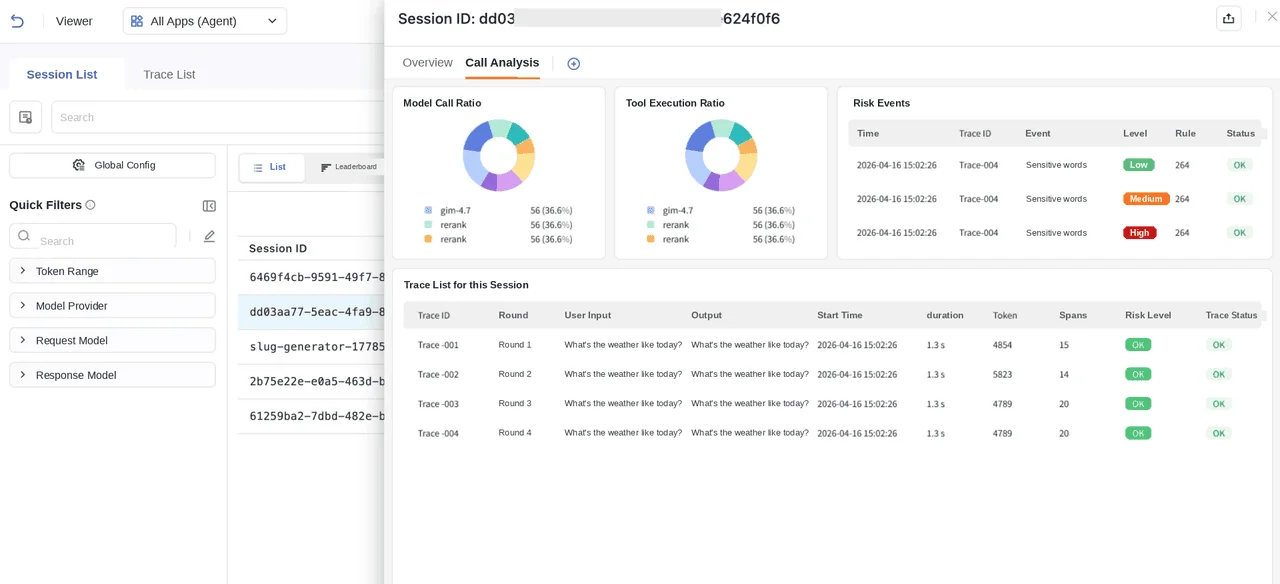
This is where agent observability becomes part of FinOps. The goal isn't counting tokens after the invoice lands — it's connecting cost directly to agent behavior, model choice, tool use, and the product workflow that triggered it.
AI Agent Governance: Risk Audit for Agent Actions
Once an agent touches production data or production tools, observability becomes a governance function.
TrueWatch's trace detail view surfaces risk events — content policy checks, sensitive-term filtering, permission boundary checks, and other policy signals — each tied to a span ID, severity, rule, and execution context. Tool execution records are logged with the same precision: timestamp, span ID, tool name, tool type, target or command, duration, status, and risk level.
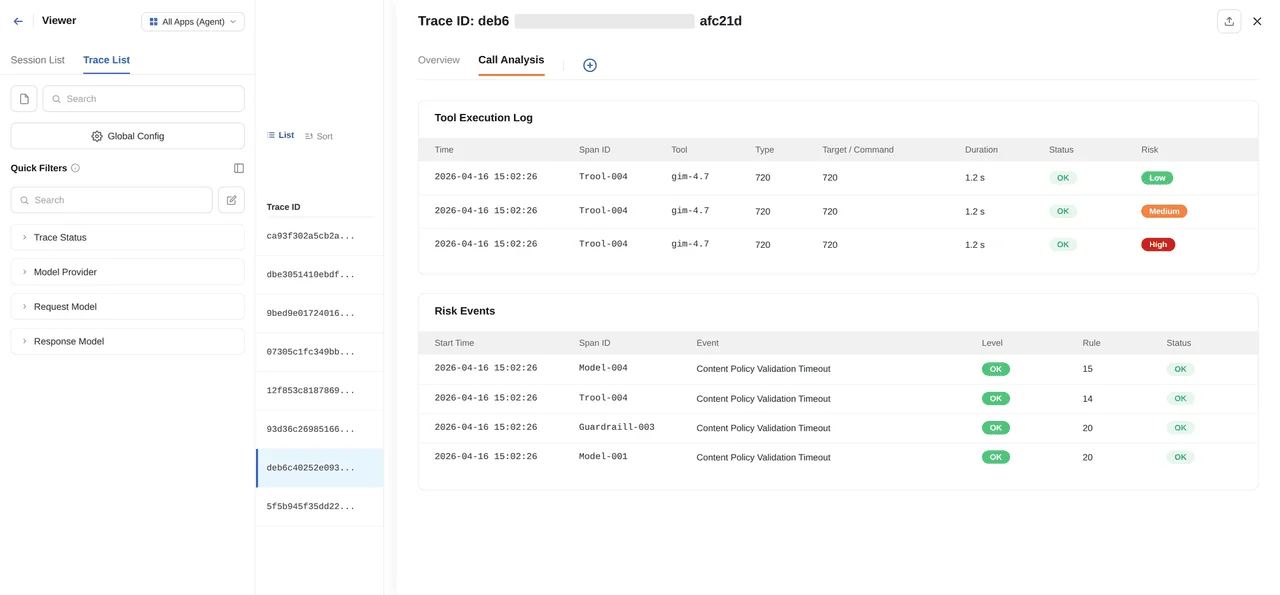
That gives teams an evidence trail. If an agent behaves unexpectedly, they can trace exactly which tool ran, what context it used, which policy fired, and where a human approval step should sit.
Setting Up AI Agent Monitoring in TrueWatch
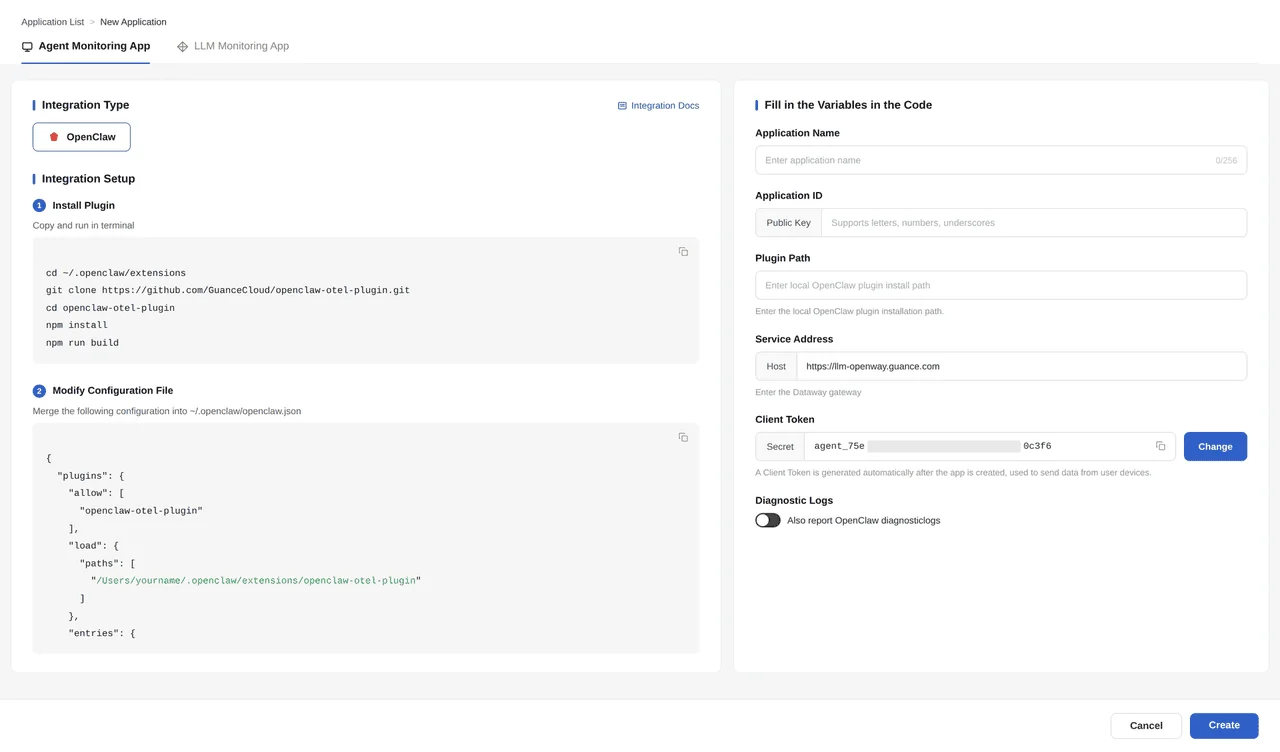
The TrueWatch console offers dedicated application paths for agent monitoring and LLM monitoring. For an OpenClaw agent, setup is three steps:
- Install the plugin.
- Update the configuration file.
- Restart and verify reporting.
The setup form generates the application name, application ID, service address, and client token.
AI Agent Observability Tools Across Frameworks
The agent ecosystem is fragmented — OpenClaw, Hermes, LangChain, CrewAI, coding agents, and internal enterprise agents all run different execution models. TrueWatch uses OpenTelemetry as the common foundation, giving teams one telemetry model instead of a separate adapter for every framework.
OpenClaw. The gateway architecture and plugin model are a natural fit for OpenTelemetry reporting, preserving session context and distributed traces across single-instance or multi-worker deployments.
Claude Code and Codex. The direction here connects coding-agent behavior to traditional service traces, so teams can follow a path like:
agent decision → API call → service trace → database queryA coding agent shouldn't be a black box separate from the systems it changes or investigates — it should leave telemetry that plugs into the same production context as services, logs, metrics, and traces.
The Bottom Line
Agent capabilities are improving quickly. Trust is the harder problem. TrueWatch AI Agent Observability brings LLM observability, sessions, traces, model and tool cost attribution, risk audit, and cross-framework telemetry into one operating view — so agent behavior is reviewable, governable, and connected to the production systems it touches.
FAQ
Q: What is AI agent observability? A: AI agent observability is the practice of tracking an AI agent's full reasoning and action chain — intent classification, model calls, tool execution, and sub-agent delegation — rather than just the outer API request that traditional APM captures.
Q: What is the best way to monitor AI agent cost? A: Effective AI agent monitoring attributes token usage and spend to specific models, tools, and workflow steps within a session, rather than aggregating cost at the application level. This turns cost tracking into an actionable FinOps input instead of a monthly surprise.
Q: What are the best AI agent observability tools for cross-framework support? A: Look for AI agent observability tools built on an open standard like OpenTelemetry, since agent frameworks (OpenClaw, LangChain, CrewAI, coding agents) are still evolving and a shared telemetry model avoids a separate integration for each one.
Q: How does AI agent governance work in an observability platform? A: AI agent governance pairs each risk event — policy checks, permission boundaries, sensitive-content filters — with the span, severity, and execution context that triggered it, creating an audit trail for how and why an agent acted.
Q: Can AI agent observability cover multi-agent systems? A: Yes. Multi agent observability requires tracing how a parent agent delegates to sub-agents and preserving that session context across the full delegation chain, not just the top-level request.
Q: What is AI agent tracing? A: AI agent tracing is the step-by-step record of an agent's execution chain — intent classification, model calls, tool execution, and sub-agent delegation — captured as a waterfall of spans rather than a single request/response log. It's what makes an agent's reasoning reviewable instead of a black box.
